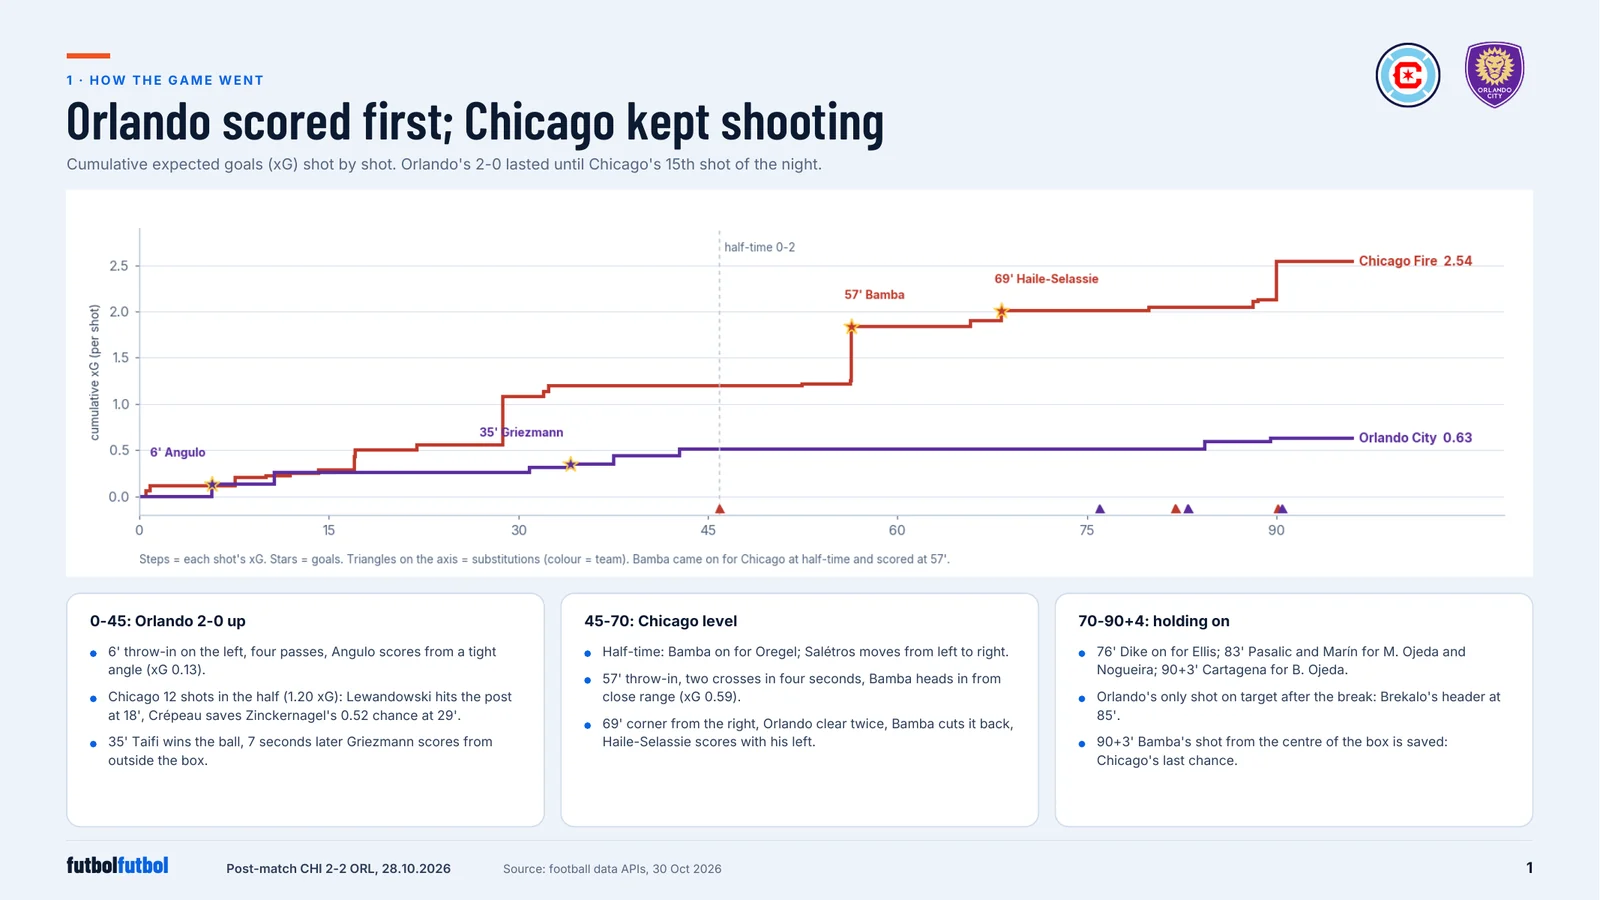
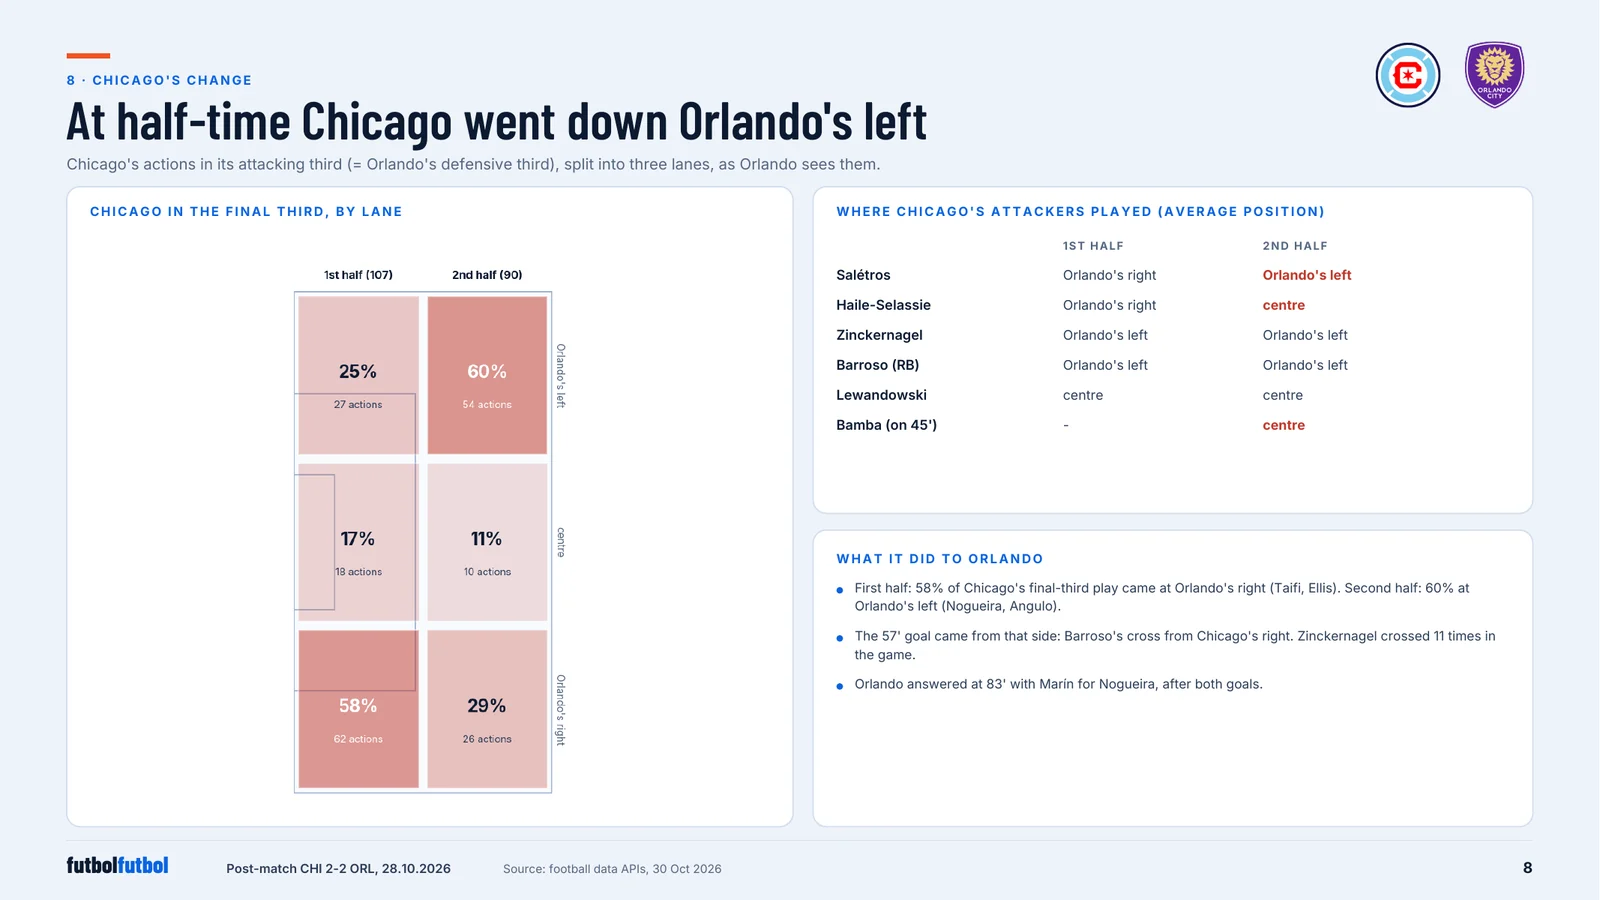
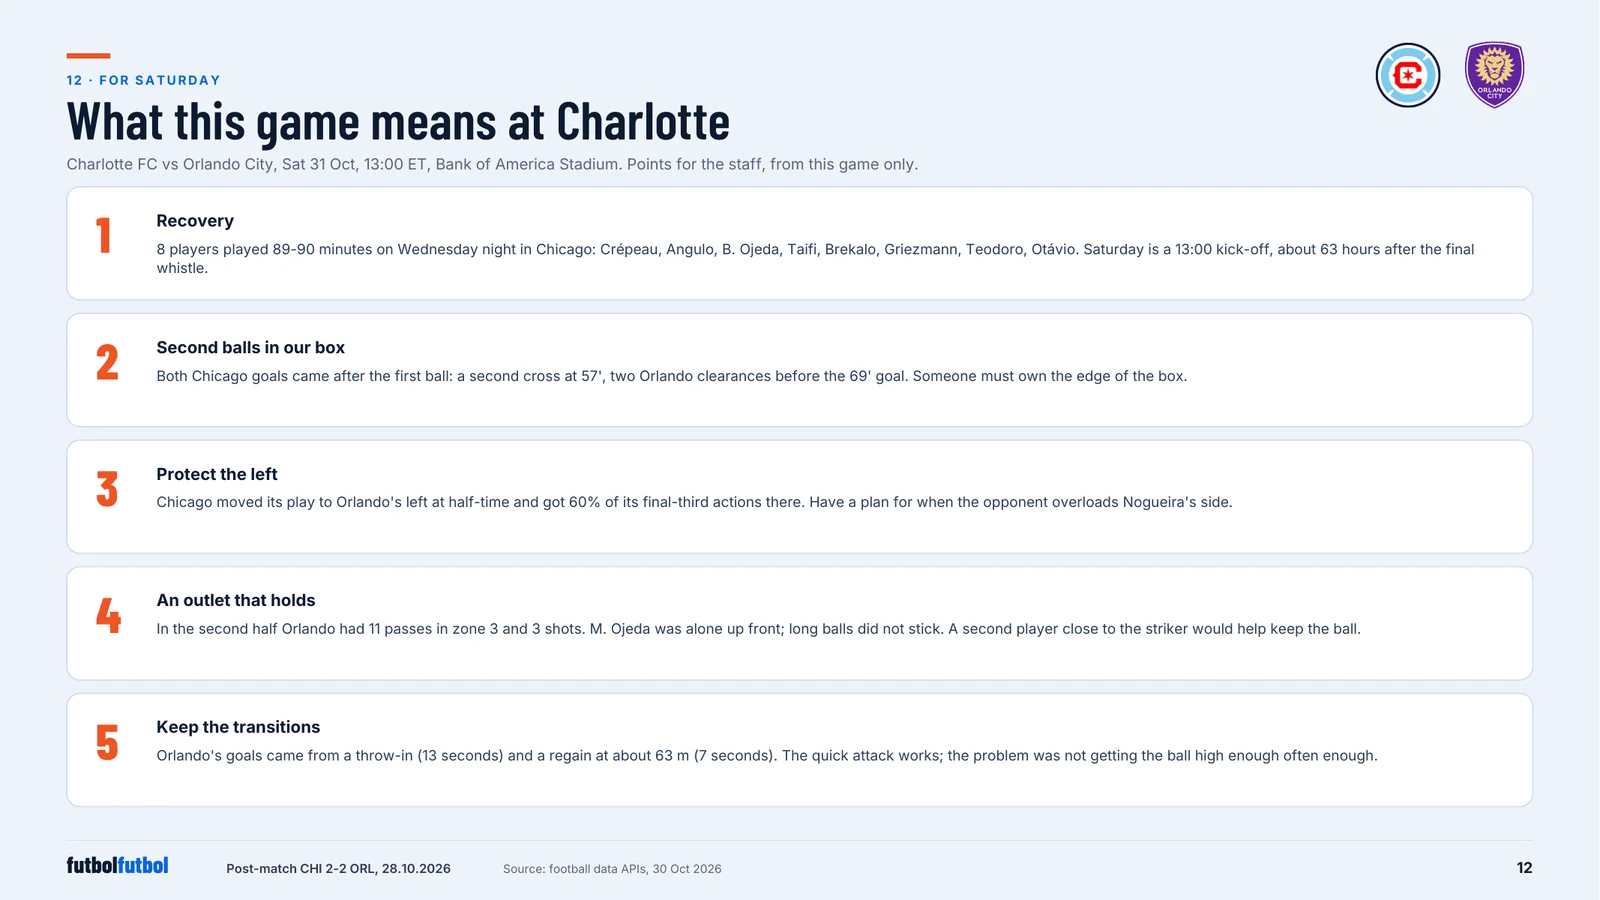
Sample work: pages from a 14-page post-match report on Chicago Fire 2-2 Orlando City (MLS, 28 October 2026), built only from public match data, with the focus on Orlando City. Orlando led 2-0 at half-time from very little, then dropped deep while Chicago moved its attack to one side and came back.
Choose a finding, compare the periods, then select an action to see where it happened. Every point comes from the report’s recorded events.
Numbers recounted against the reportCoaching questions await football analyst review.
What happened
Chicago changed sides at half-time
Chicago’s final-third actions on Orlando’s left rose from 27 of 107 before half-time to 54 of 90 after it.
25%First-half share
60%Second-half share
54 / 90Second-half actions on the left
Why we think that
The share rose from 25% to 60%. The report identifies the half-time reshuffle and Barroso’s cross from that side before the 57′ goal. Select either half and lane to inspect the counted events.
Second half · Focus team’s left · 54 actions / 90 (60%)
Orlando City →← Chicago Fire
Fixed view: the focus team attacks right. Coordinates are on-ball locations on a standardized 105 × 68 m pitch, not player tracking.
Recorded actions
Select a recorded action. Arrows show recorded starts and ends, not an inferred ball path. Event counts are not possession counts.
What the staff could consider
When the opponent overloads our left, who supports the full-back and who protects the next cross?
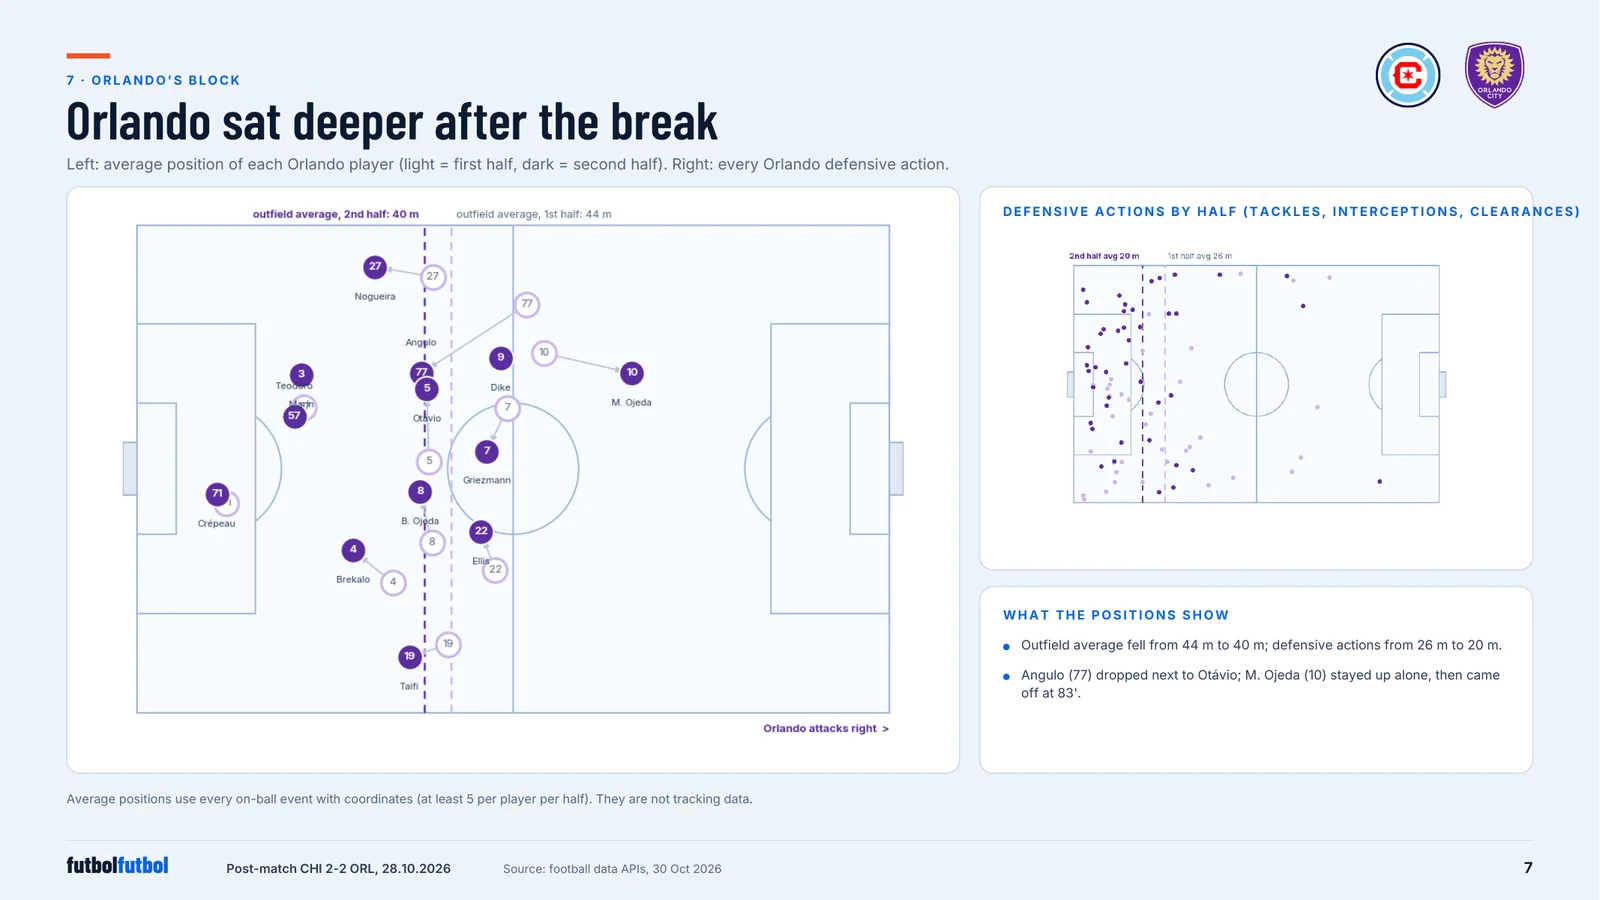
Orlando’s defensive actions averaged about 26 m from its own goal in the first half and 20 m in the second.
26 → 20 mMean distance from own goal
39 / 43Second-half actions in own third
24 → 11Final-third passes by half
Why we think that
After the break 39 of 43 defensive actions were in Orlando’s own third. Its final-third passes also fell from 24 to 11. Compare the locations rather than treating the scoreline as control.
Second half · 43 actions · Mean defensive-action distance from own goal: 19.8 m · In own third: 39/43
Orlando City →← Chicago Fire
Fixed view: the focus team attacks right. Coordinates are on-ball locations on a standardized 105 × 68 m pitch, not player tracking.
Recorded actions
Select a recorded action. Arrows show recorded starts and ends, not an inferred ball path. Event counts are not possession counts.
What the staff could consider
With a lead, what outlet and nearby support could help us keep the next ball instead of defending another wave?
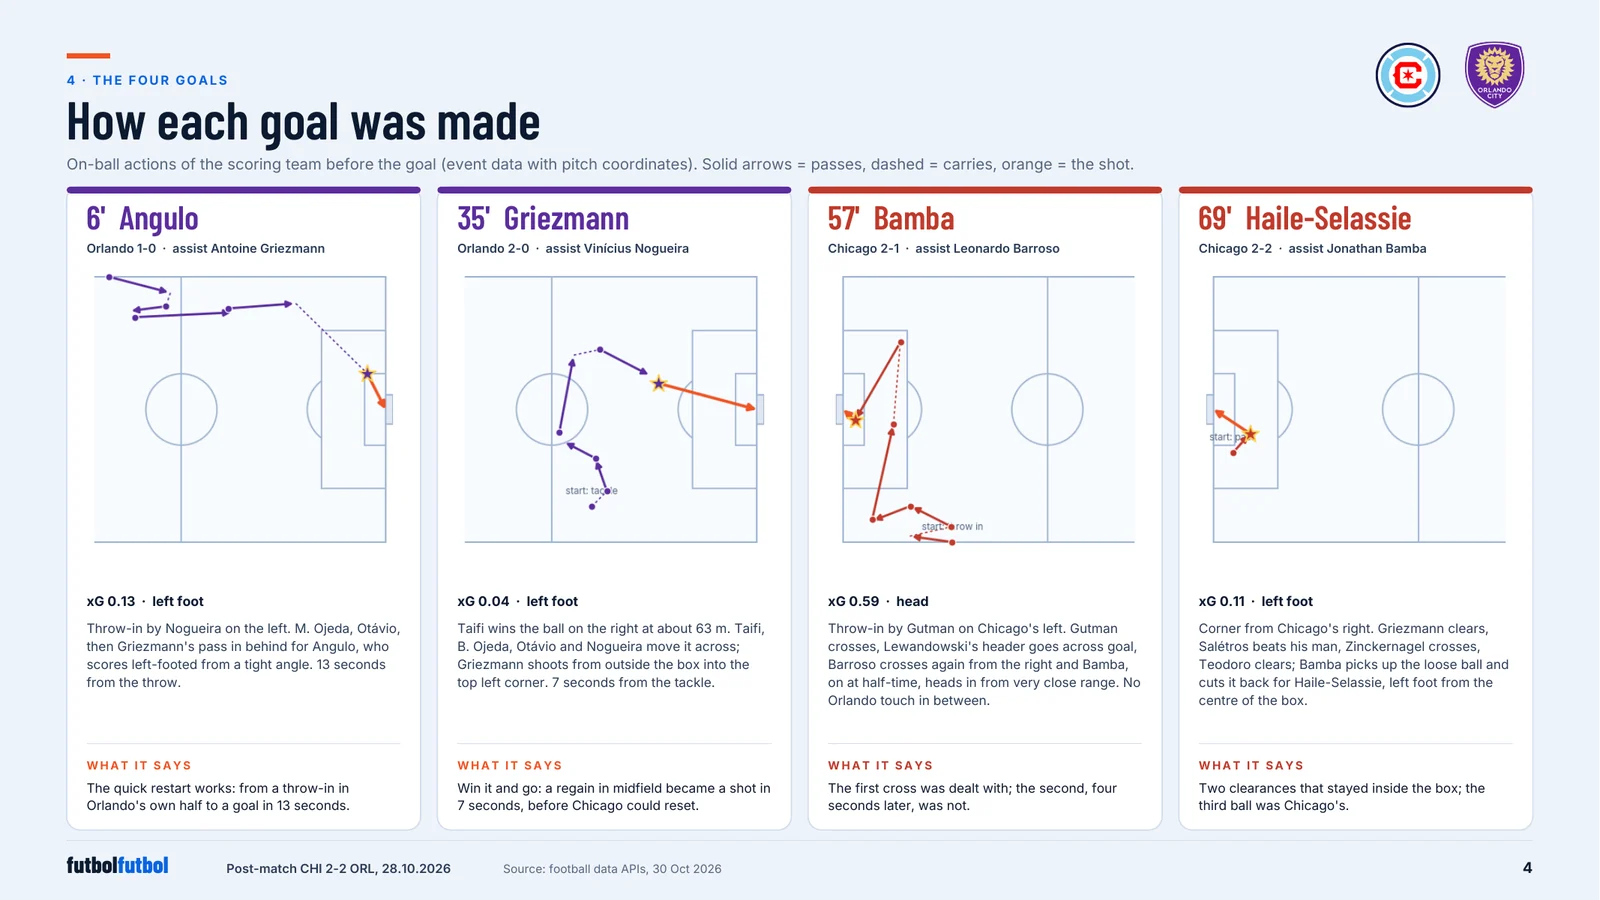
At 57′ Chicago crossed again before Bamba scored. At 69′ Orlando cleared twice before Haile-Selassie equalized.
57′ + 69′Goals conceded
2Clearances before the equalizer
0.59 / 0.11Goal-shot xG (event model)
Why we think that
The 25-second event windows retain both teams’ actions, including the two Orlando clearances before the equalizer. Select a goal, then follow the recorded passes, crosses and shot locations.
57' · Jonathan Bamba · 11 actions · xG 0.595
Orlando City →← Chicago Fire
Fixed view: the focus team attacks right. Coordinates are on-ball locations on a standardized 105 × 68 m pitch, not player tracking.
Recorded actions
Select a recorded action. Arrows show recorded starts and ends, not an inferred ball path. Event counts are not possession counts.
What the staff could consider
After the first clearance or cross, who takes the next ball and who protects the cutback zone?
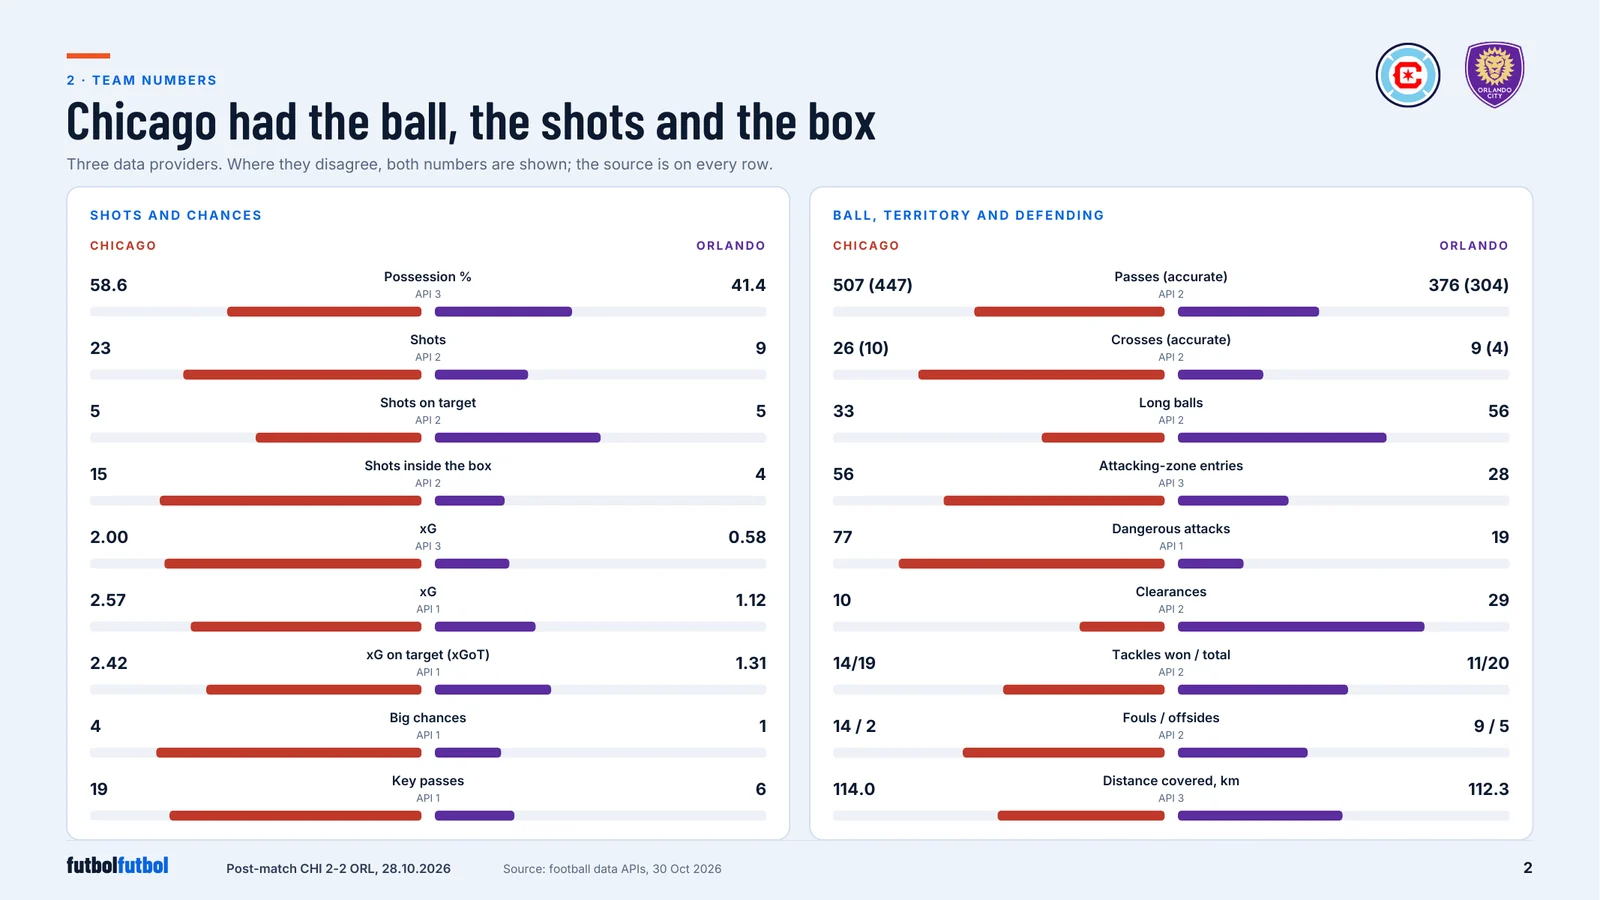
Full-match totals. Model disagreement is not a statistical confidence interval.
Team
API 1
API 2
API 3
Orlando City
1.12
0.63
0.58
Chicago Fire
2.57
2.54
2.00
Event diagrams only. Match video will be added when permission is available.
Inside the report
Six of the fourteen pages.
How the game went. Chance quality shot by shot, with every goal and substitution.Team numbers. Three football data APIs side by side; where they disagree, both are shown.How each goal was made. Every pass before each goal, drawn on the pitch.The block. Average positions and defensive actions, first half against second.The opponent's change. Final-third play by lane, before and after half-time.Five points for the next game. What the staff can take into the next match week.
Honest about the limits
What this sample cannot show.
It uses public match data only. Positions come from on-ball events, not tracking, so players off the ball are not seen. Different data models give different xG; the report shows them side by side.
With a club's own statistics, GPS and match video, the same report adds tracking, physical load and drawn clips.
Data usedPublic match events, team and player statistics.
DeliveredThe day after the game, as a 14-page report.
With a clubPlus the club's statistics, GPS (XML or CSV) and video, and live notes on match day.
See it on one of your own games.
We send a sample report built on one of your recent games.