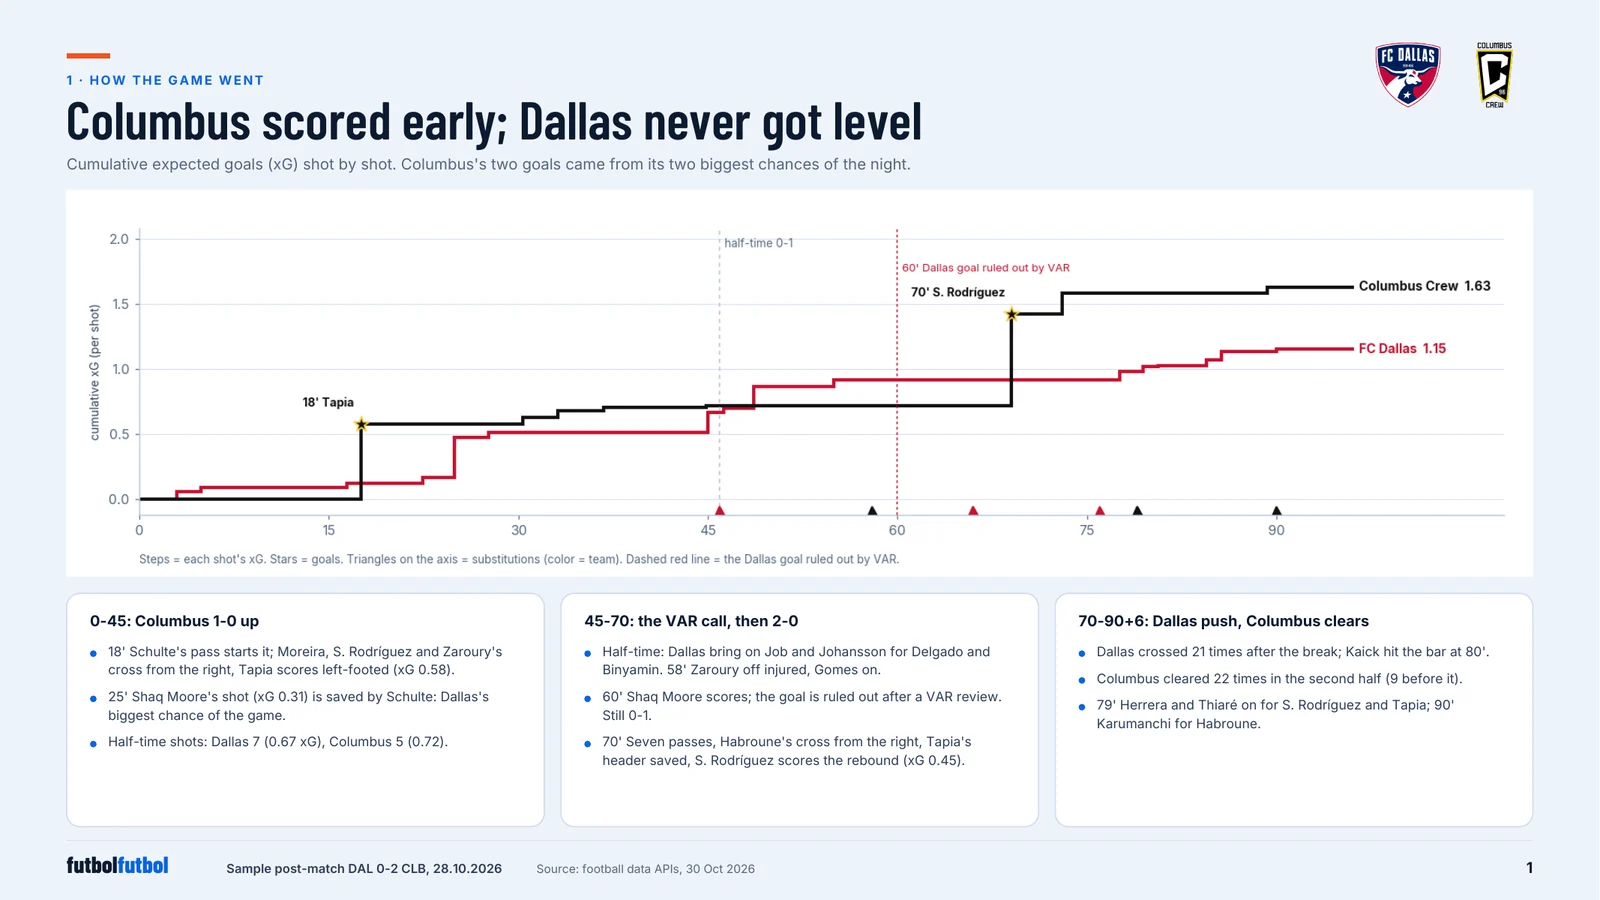
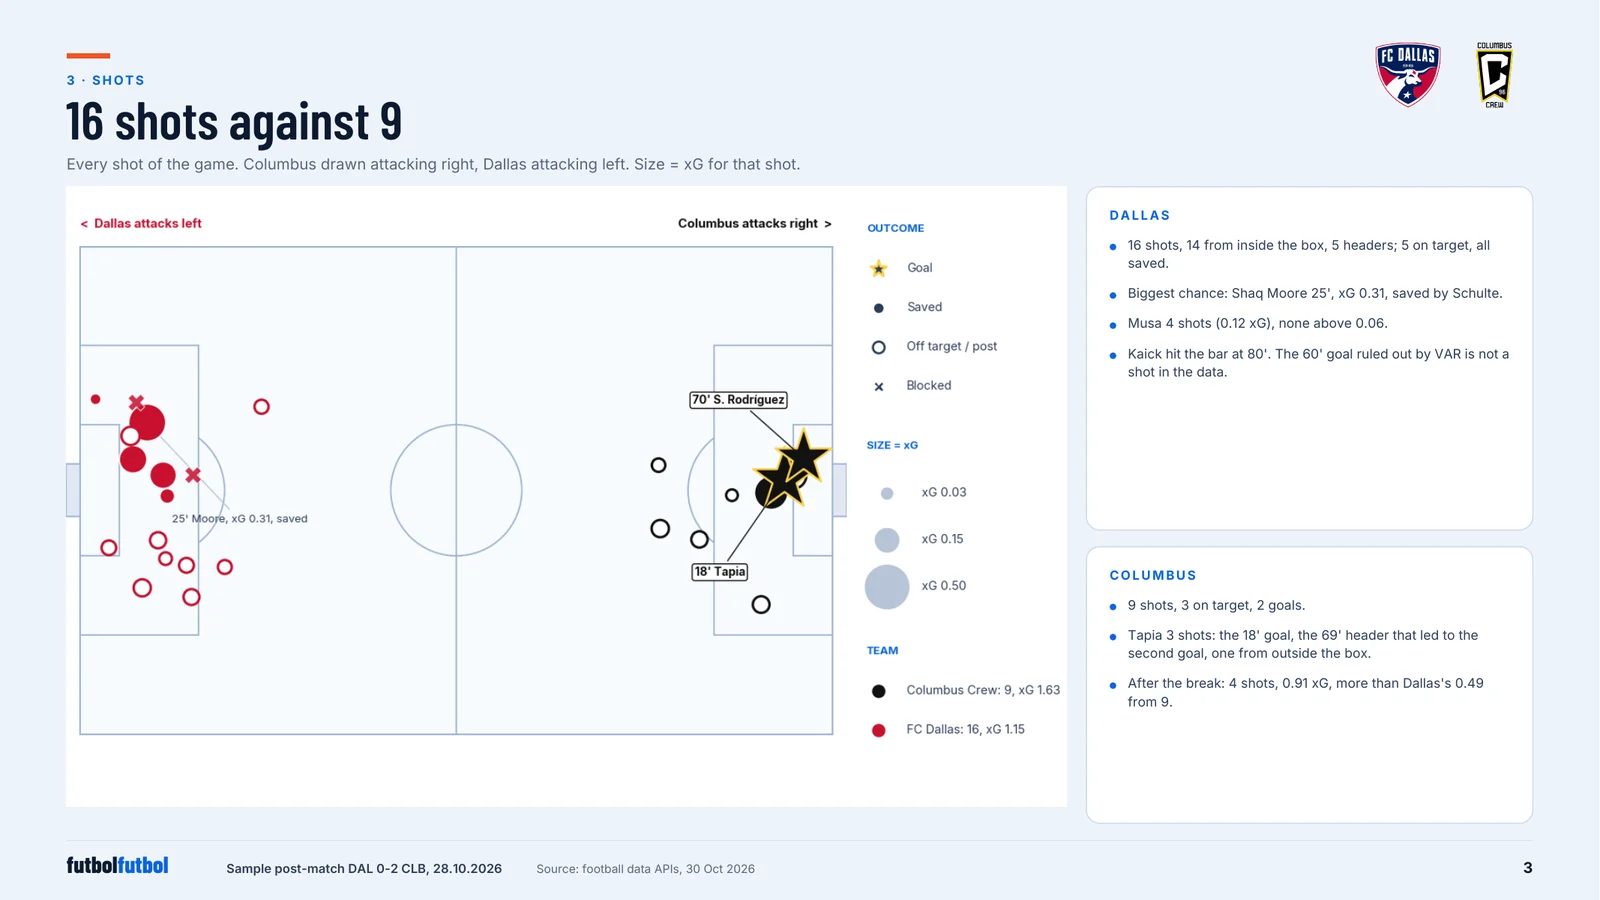
Sample work: pages from a 14-page post-match report on FC Dallas 0-2 Columbus Crew (MLS, 28 October 2026), built only from public match data, with the focus on Columbus Crew. Columbus won away with 9 shots against Dallas's 16, scoring from its two biggest chances (xG 0.58 and 0.45). After the break it defended deep while Dallas crossed 21 times, had a goal ruled out by VAR at 0-1 and created only 0.49 xG.
Choose a finding, compare the periods, then select an action to see where it happened. Every point comes from the report’s recorded events.
Numbers recounted against the reportCoaching questions await football analyst review.
What happened
The two biggest chances became goals
Columbus scored with its two highest-xG shots: Tapia at 18′ and Rodríguez at 70′.
9 / 16Shots: Columbus / Dallas
0.58 + 0.45xG of the scoring shots
2Goals from the two biggest chances
Why we think that
Columbus had 9 shots against Dallas’s 16. The scoring shots were worth 0.578 and 0.454 xG in the event model. Select each shot to compare its recorded location and value.
Columbus Crew · 9 actions · xG 1.633
Columbus Crew →← FC Dallas
Fixed view: the focus team attacks right. Coordinates are on-ball locations on a standardized 105 × 68 m pitch, not player tracking.
Recorded actions
Select a recorded action. Arrows show recorded starts and ends, not an inferred ball path. Event counts are not possession counts.
What the staff could consider
Which repeatable movements created these close-range chances, and can we recreate them against a different defensive shape?
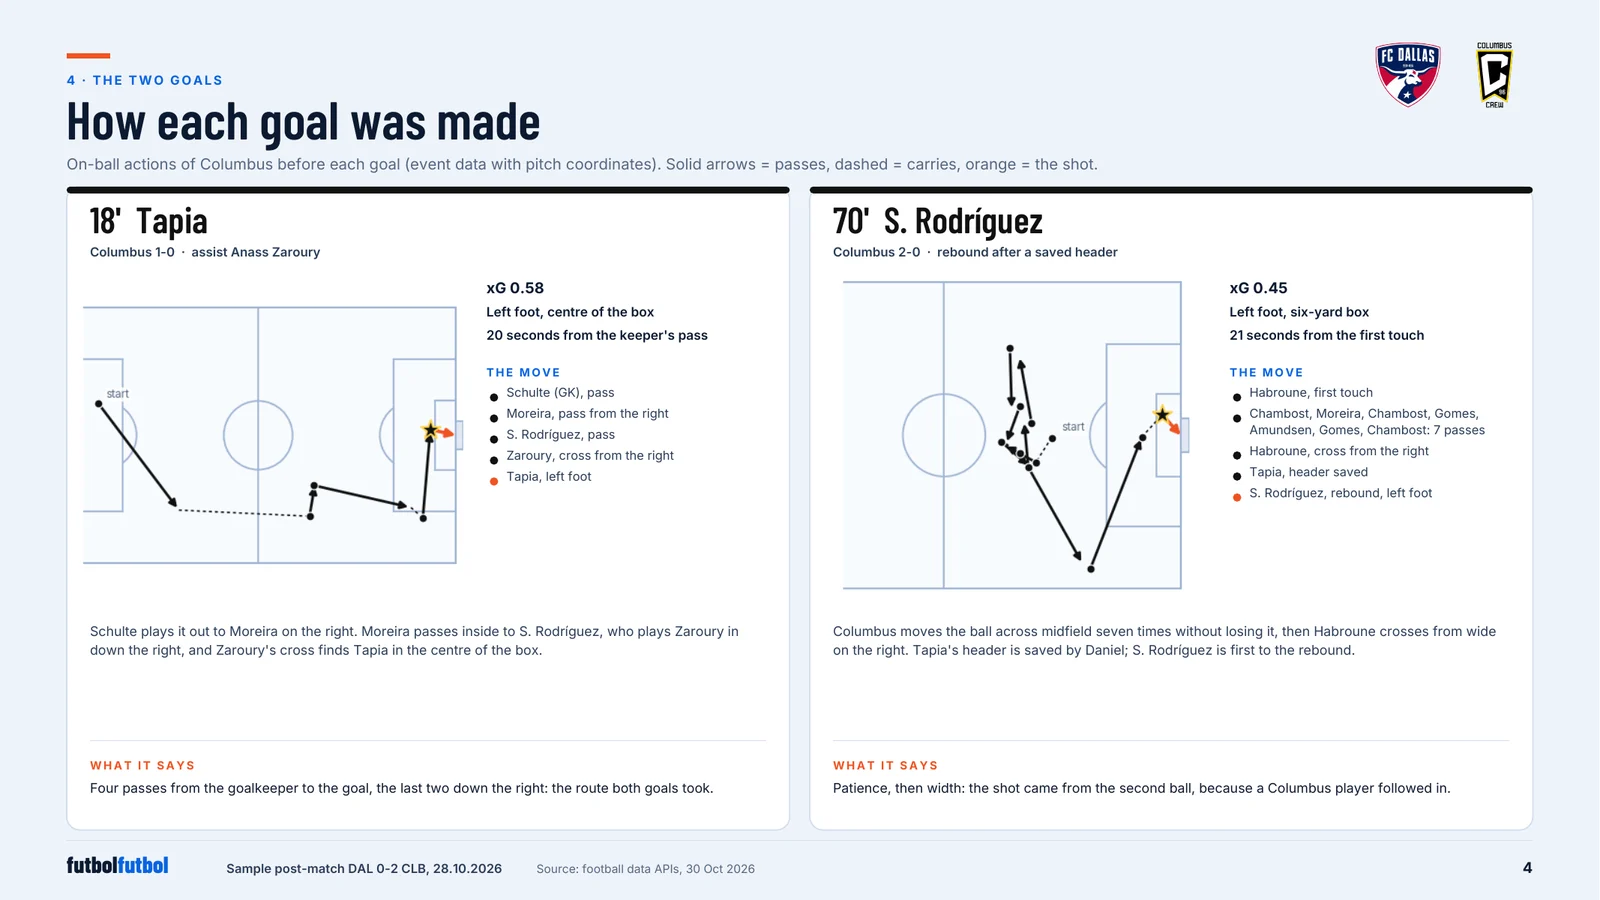
Both scoring sequences used a cross from the right
Zaroury crossed from the right before Tapia’s opener. Habroune crossed from the same side before the rebound finished by Rodríguez.
18′ + 70′Columbus goals
2 / 2Scoring sequences with a right-side cross
70′Rebound goal
Why we think that
Both recorded crosses start in Columbus’s right lane. The second sequence includes Tapia’s saved shot before Rodríguez scores. Select the actions to inspect both deliveries and the rebound.
18' · Gonzalo Tapia · 7 actions · xG 0.578
Columbus Crew →← FC Dallas
Fixed view: the focus team attacks right. Coordinates are on-ball locations on a standardized 105 × 68 m pitch, not player tracking.
Recorded actions
Select a recorded action. Arrows show recorded starts and ends, not an inferred ball path. Event counts are not possession counts.
What the staff could consider
What gave the right-side crosser time, and who attacks the rebound if the first shot is saved?
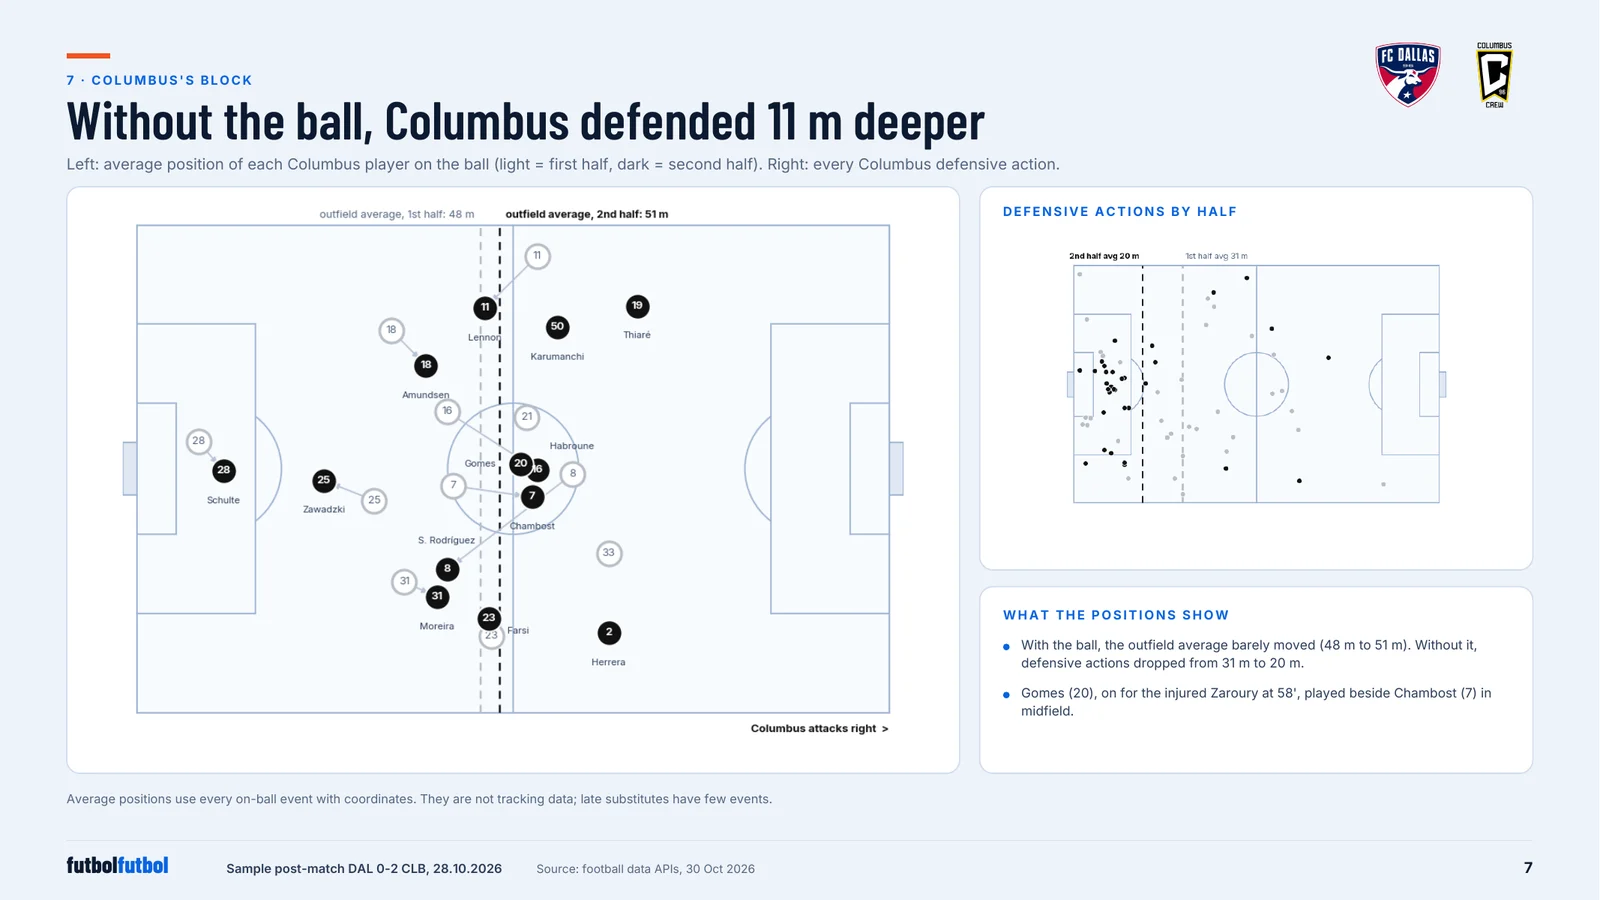
Columbus’s defensive-action average moved from about 31 m to 20 m from its own goal after half-time.
31 → 20 mMean distance from own goal
26 / 32Second-half actions in own third
0.49Dallas second-half xG
Why we think that
In the second half 26 of 32 defensive actions were in its own third. Dallas crossed 21 times and generated 0.486 xG in the event model; a Dallas goal was ruled out at 60′.
Second half · 32 actions · Mean defensive-action distance from own goal: 19.7 m · In own third: 26/32
Columbus Crew →← FC Dallas
Fixed view: the focus team attacks right. Coordinates are on-ball locations on a standardized 105 × 68 m pitch, not player tracking.
Recorded actions
Select a recorded action. Arrows show recorded starts and ends, not an inferred ball path. Event counts are not possession counts.
What the staff could consider
Which box-protection duties held up, and what would we change if a similar opponent produced clearer chances?
Full-match totals. Model disagreement is not a statistical confidence interval.
Team
API 1
API 2
API 3
Columbus Crew
1.36
1.63
1.51
FC Dallas
1.15
1.15
1.51
Event diagrams only. Match video will be added when permission is available.
Inside the report
Six of the fourteen pages.
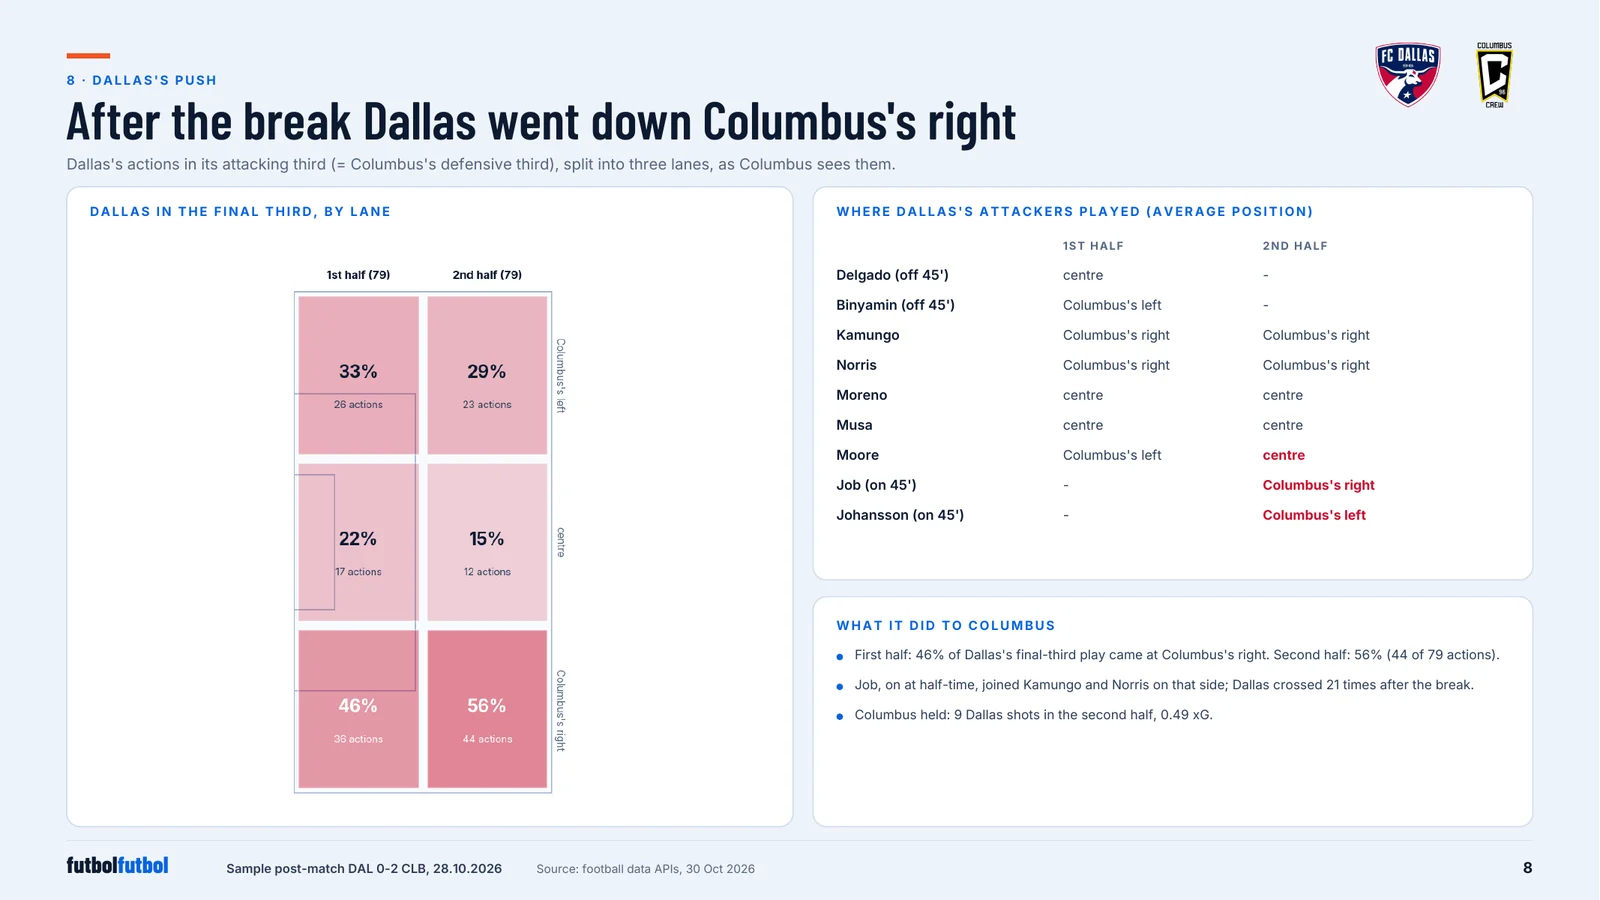
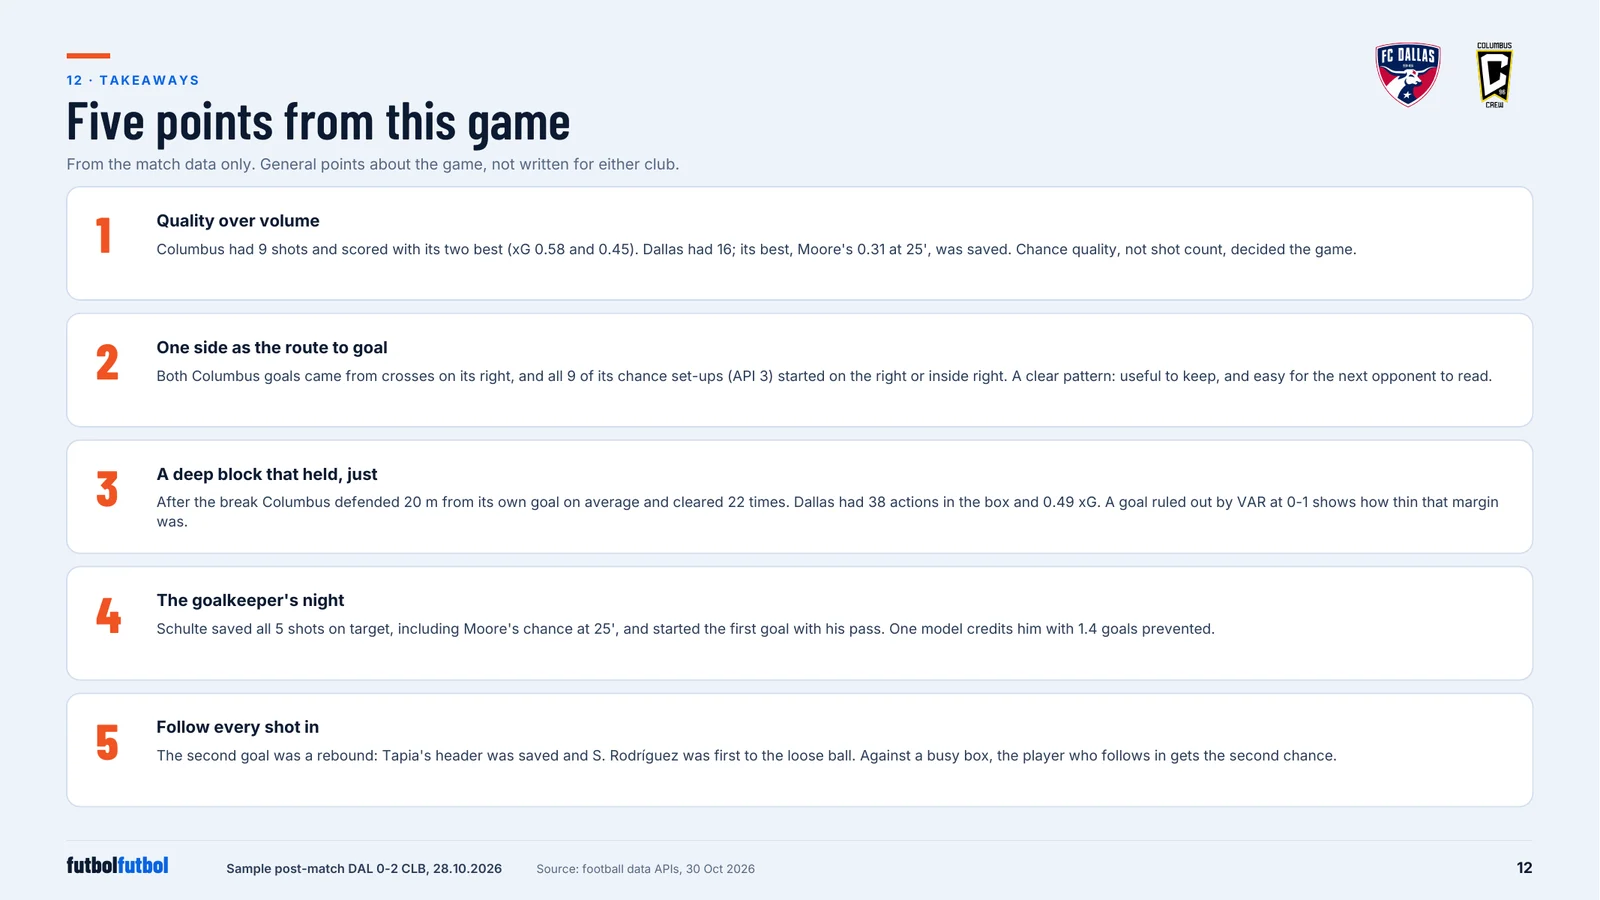
How the game went. Cumulative xG shot by shot. Columbus's two goals came from its two biggest chances; Dallas kept adding shots without catching up.Every shot. 16 shots against 9. Dallas shot often from crowded positions; Columbus's few shots were closer to goal and bigger chances.How each goal was made. Four passes from the goalkeeper for the first goal; seven passes, a cross from the right and a rebound for the second.Columbus's block. With the ball, Columbus's average position barely moved; without it, its defensive actions dropped 11 m closer to its own goal after the break.Dallas's push. After the break 56% of Dallas's final-third play went down Columbus's right, up from 46%, with a third attacker joining that side.Five points from this game. Quality over volume, one side as the route to goal, a deep block that held, the goalkeeper's night, and following every shot in.
Honest about the limits
What this sample cannot show.
It uses public match data only. Positions come from on-ball events, not tracking, so players off the ball are not seen. Different data models give different numbers; the report shows them side by side.
With a club's own statistics, GPS and match video, the same report adds tracking, physical load and drawn clips.
Data usedPublic match events, team and player statistics.
DeliveredThe day after the game, as a 14-page report.
With a clubPlus the club's statistics, GPS (XML or CSV) and video, and live notes on match day.
See it on one of your own games.
We send a sample report built on one of your recent games.