
Sample work - Orlando City SC vs New England Revolution
Orlando City SC vs New England Revolution
Sample work: pages from a 26-page pre-game report on Orlando City SC vs New England Revolution (MLS, last matchday, 7 November 2026), built only from public match data. It covers what each side plays for, the 81 combinations of the day's four matches, the season and trend of both teams, the four phases of play by zone, two statistical models and six keys to the match.
What the report showed
Three points from the numbers.
Clinched, but the seed is open
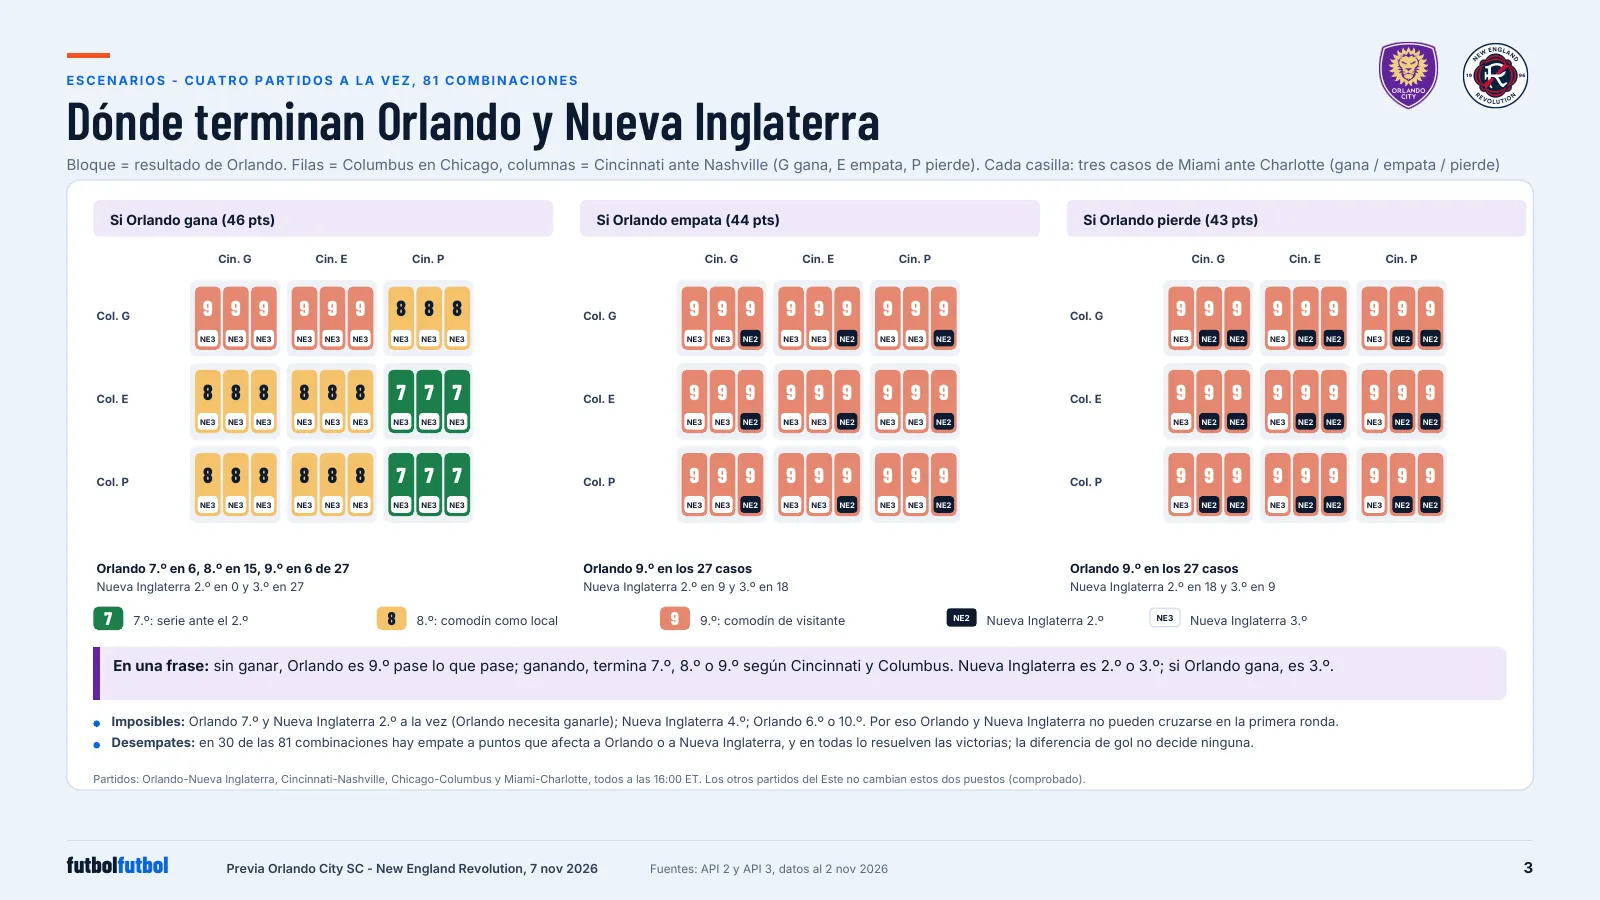
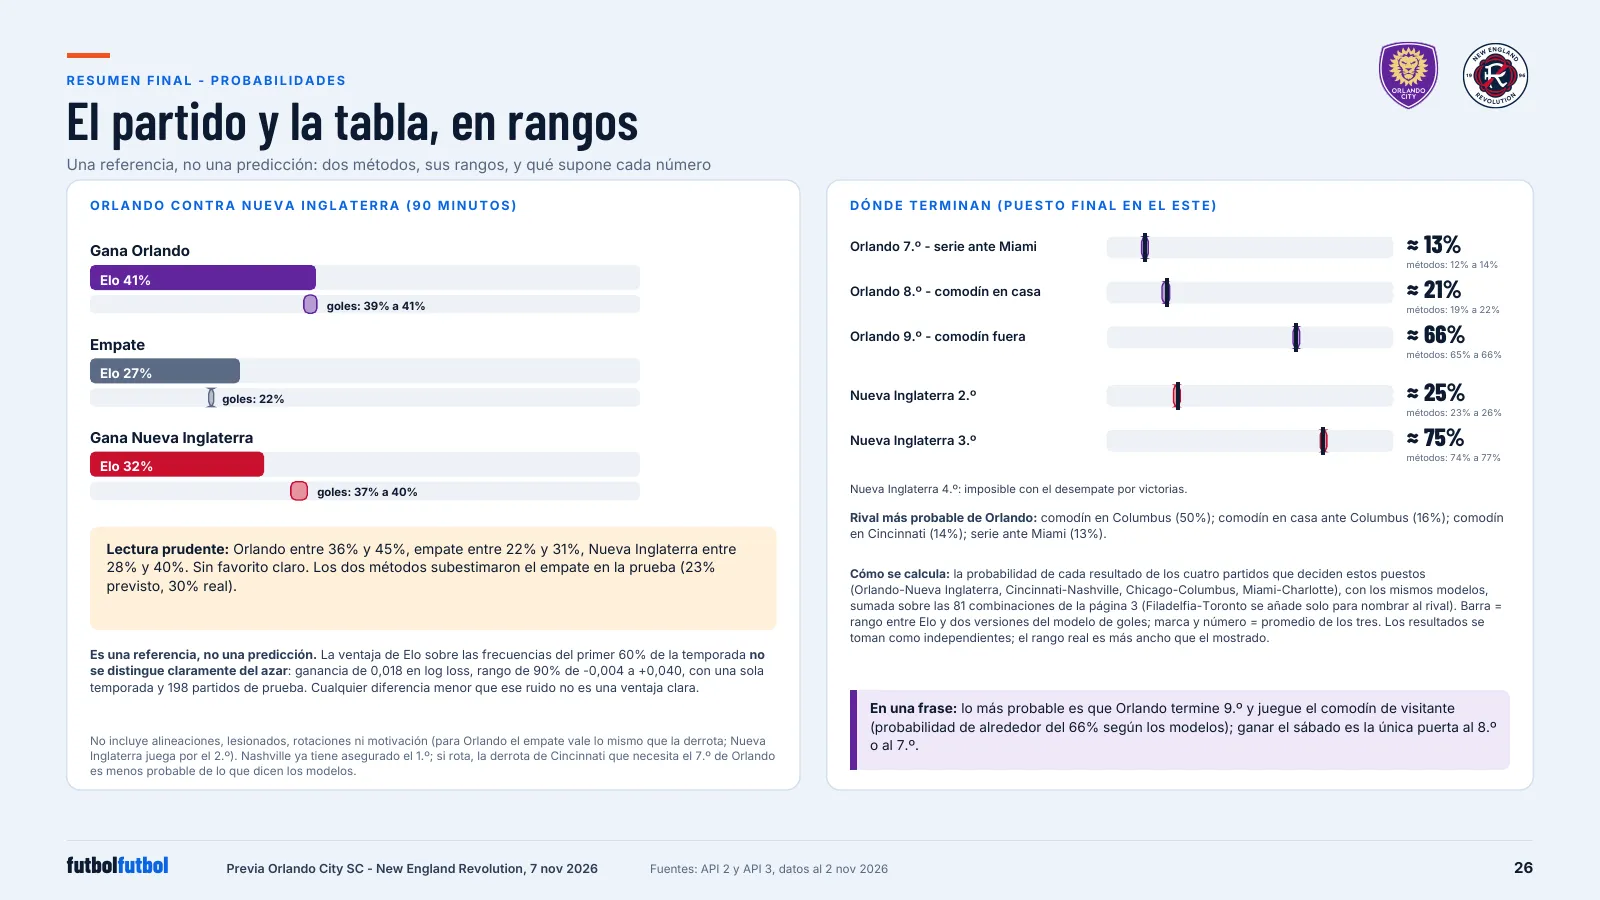
Orlando is in the playoffs. A draw or a loss means 9th in all 54 combinations. A win gives 7th in 6 of 27, 8th in 15 and 9th in 6. New England finishes 2nd or 3rd, and a loss means 3rd.
New England 4-2 Orlando, 19 September
It was 2-2 at 88 minutes and New England scored at 90+3 and 90+6. Expected goals were 2.21 to 1.50 on one feed. The report uses it as context, with the sample-size caution attached.
Overlapping ranges, no clear favourite
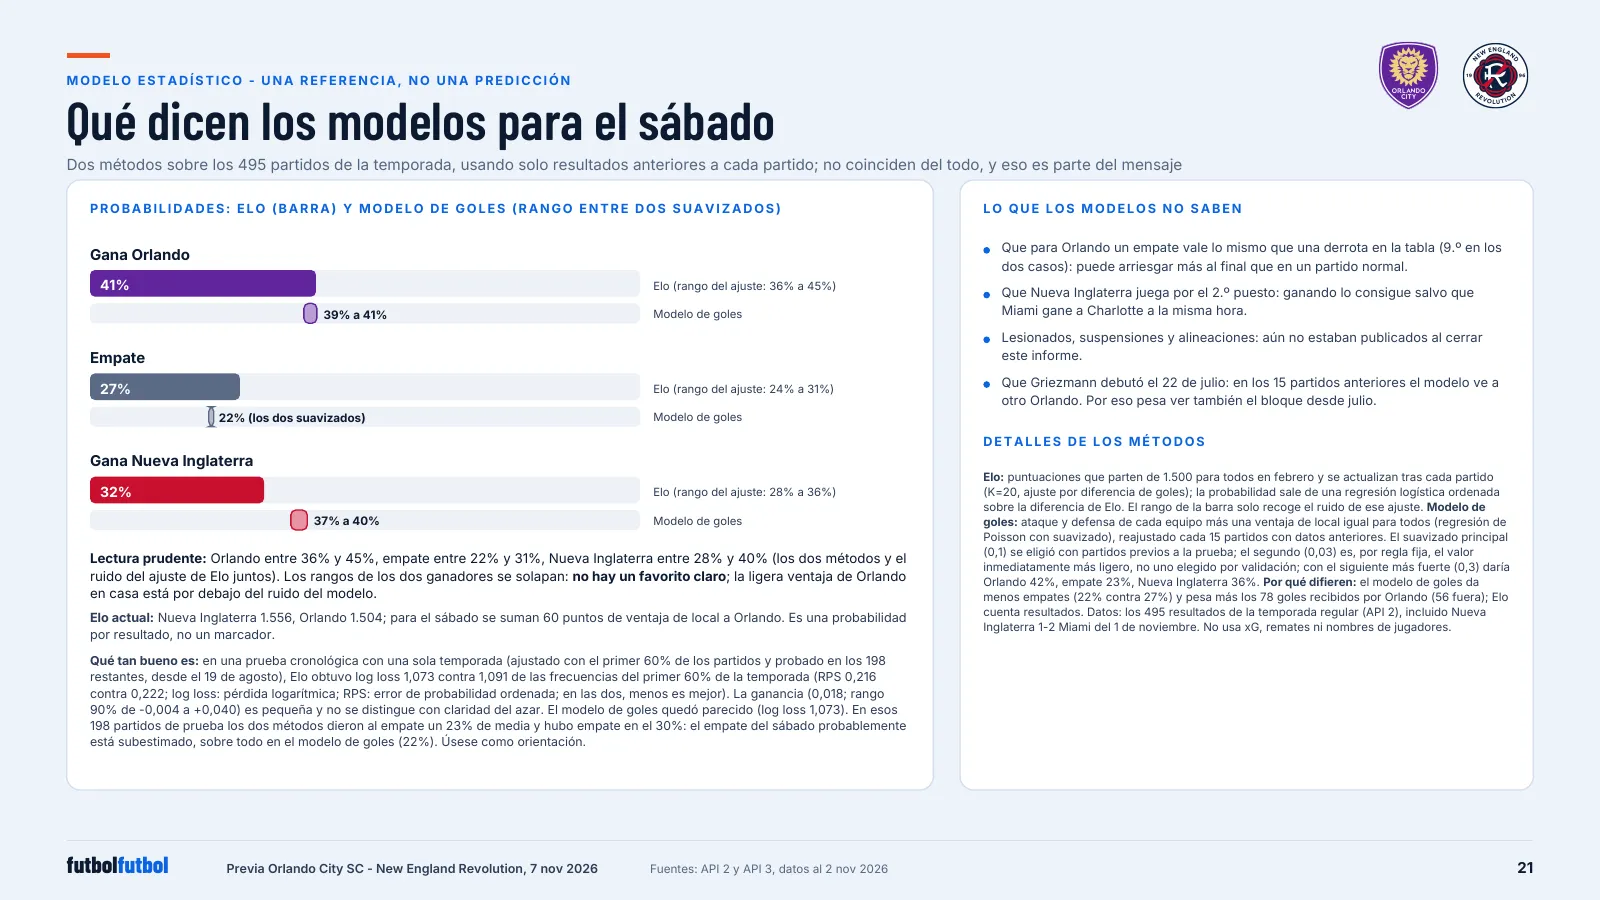
The ranges are 36 to 45% for Orlando, 22 to 31% for the draw and 28 to 40% for New England. They overlap, both models under-predict draws, and the page says so.
Inside the report
Six of the 26 pages.
The report was written in Spanish, so its pages are shown in Spanish.
Honest about the limits
What this sample cannot show.
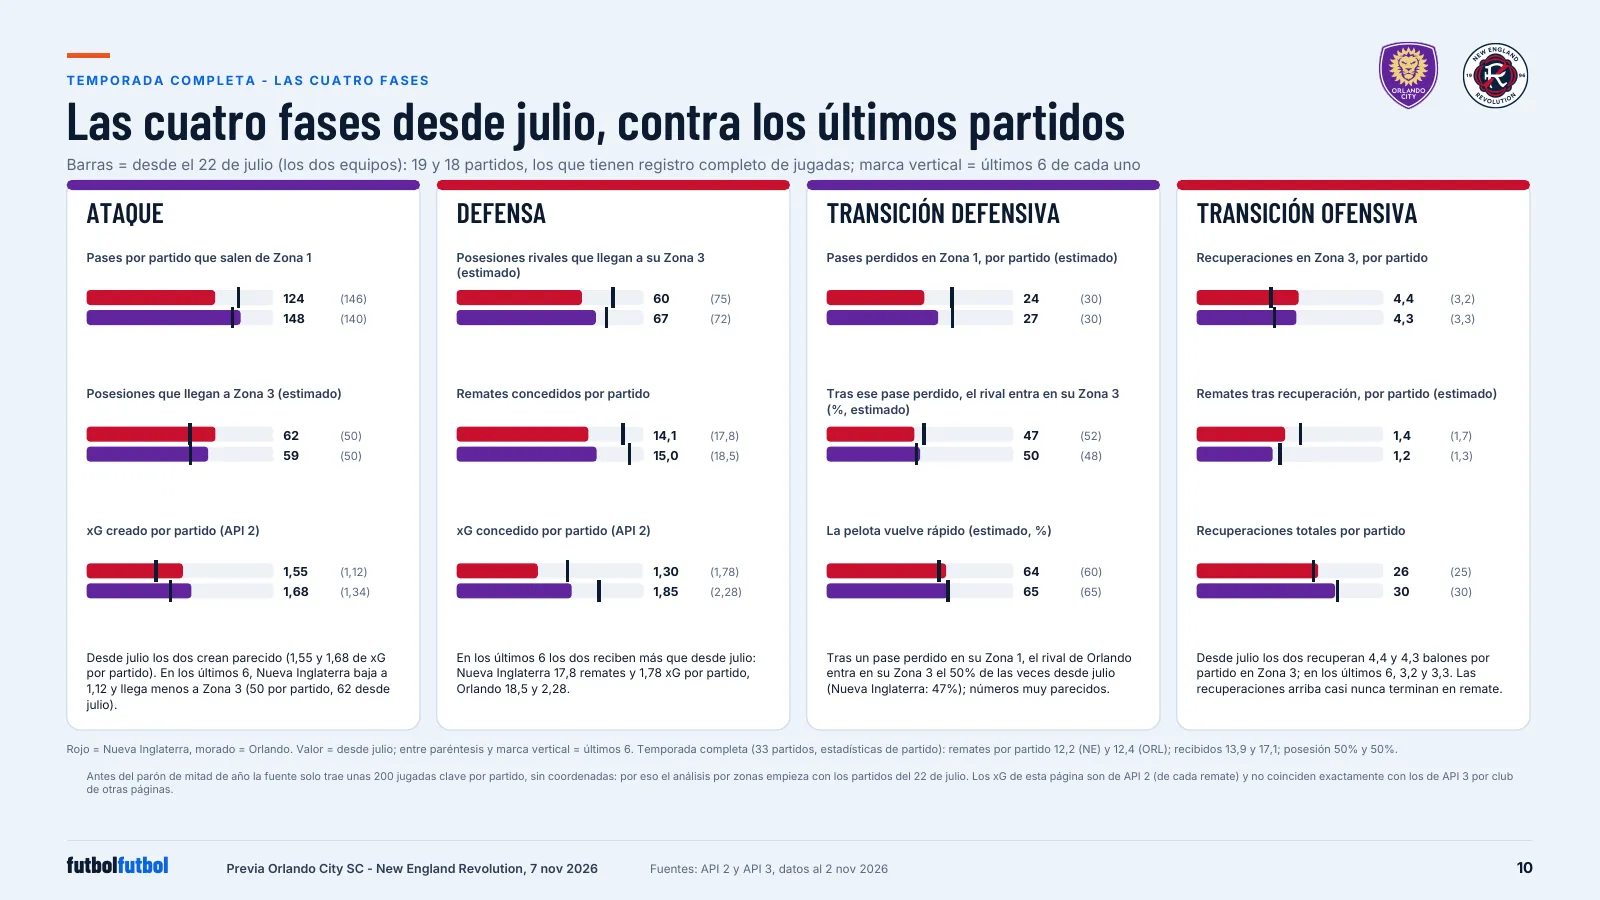
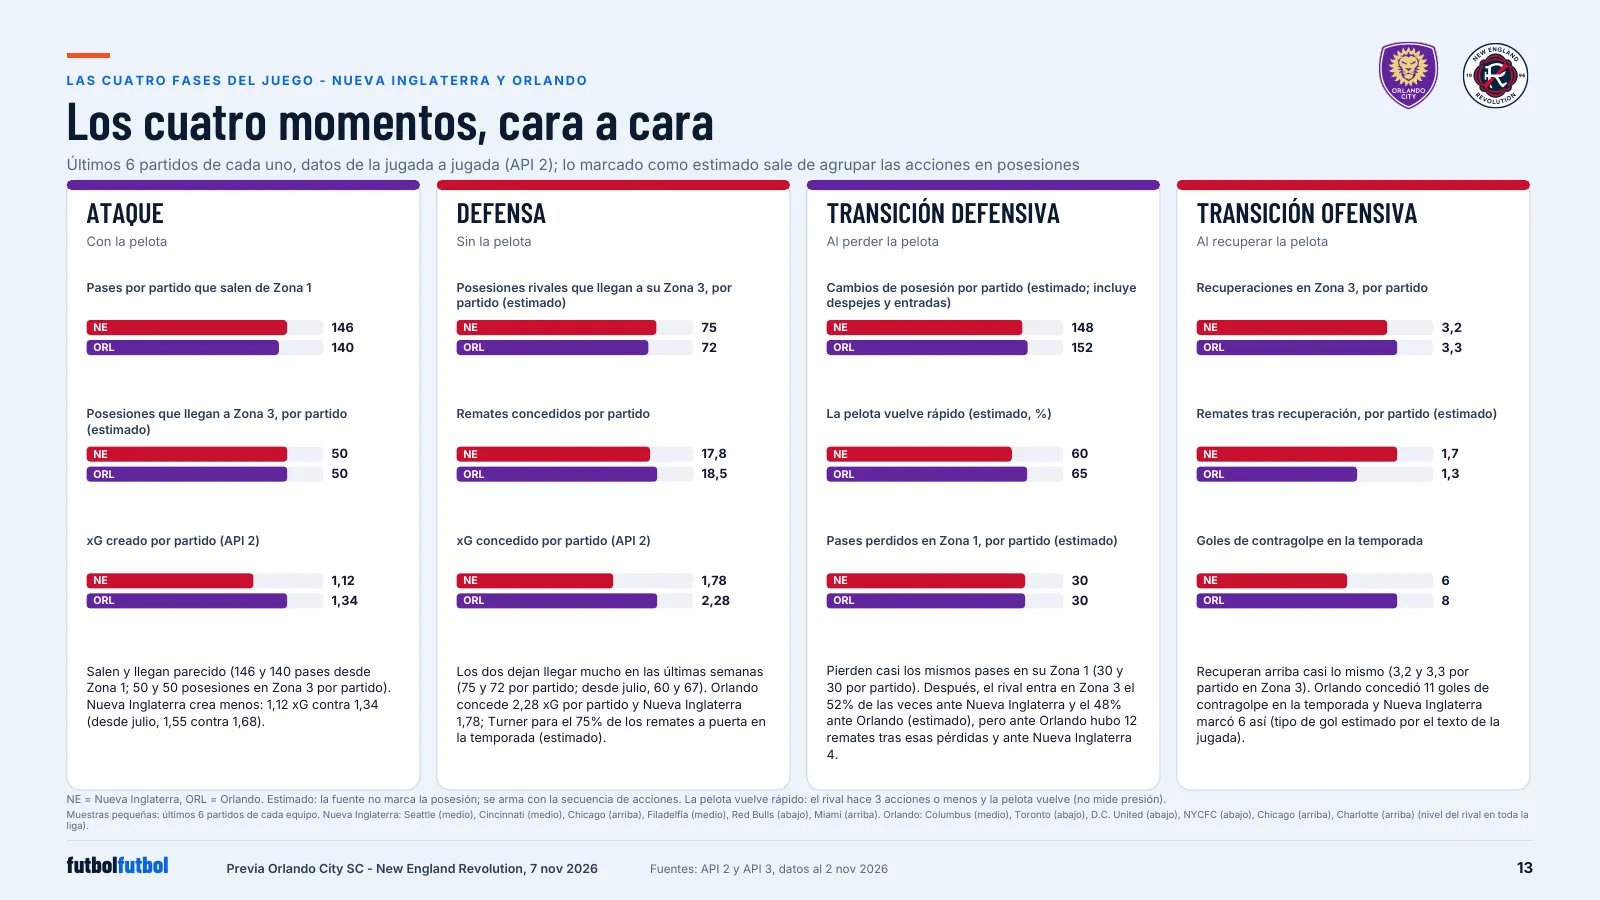
It uses public match data only. Positions come from on-ball events, not tracking, so players off the ball are not seen. Different data services give different expected goals; the report shows both side by side and does not treat either as the true value. Every figure is marked as direct data, an estimate, or something that needs match video.
With a club's own statistics, GPS and match video, the same report adds tracking, physical load and drawn clips.
See it on one of your own games.
We send a sample report built on one of your recent games.