Skip to content
futbolfutbol logofutbolfutbol
Menu

Sample work · Necaxa 1-1 FC Juárez

Necaxa 1-1 FC Juárez

Sample work: pages from a 14-page post-match report on Necaxa 1-1 FC Juárez (Liga MX, 23 October 2026), built only from public data, with the focus on Necaxa. The report itself is written in Spanish, as the club would receive it. Necaxa created the clearer chances, xG 2.81 to 1.79, and led 1-0 at the break through Owen González. It missed a penalty and two big late chances, and Juárez equalized at 82' from the second phase of a corner.

What the report found

Three findings a staff could act on the next day.

01 · CHANCE QUALITY

More chances, one goal

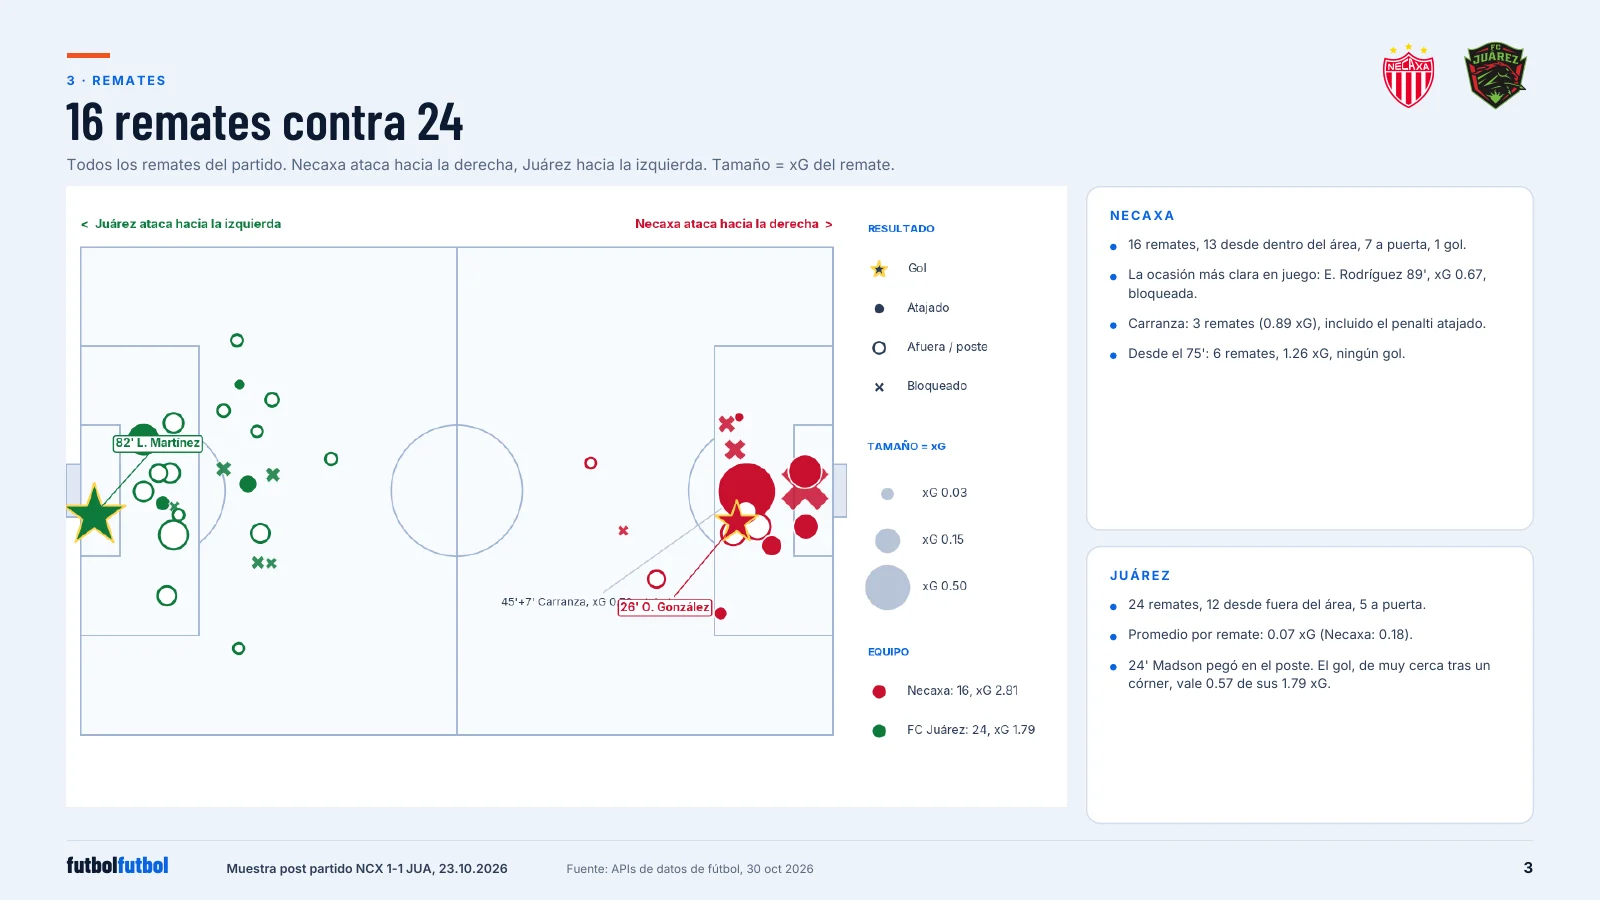
Necaxa had 16 shots to Juárez's 24, but 13 came from inside the box: xG 2.81 to 1.79 (another model: 3.31 to 1.63). Juárez took 12 of its 24 shots from outside the box, at 0.07 xG per shot against Necaxa's 0.18.

02 · THE MISSES

A penalty and two late chances

Carranza's penalty at 45+7' was saved (xG 0.79). At 89' one shot was blocked (0.67) and another saved (0.25): 1.71 xG without a goal. One model credits Juárez's goalkeeper with 1.8 goals prevented.

03 · THE EQUALIZER

The second ball from a corner

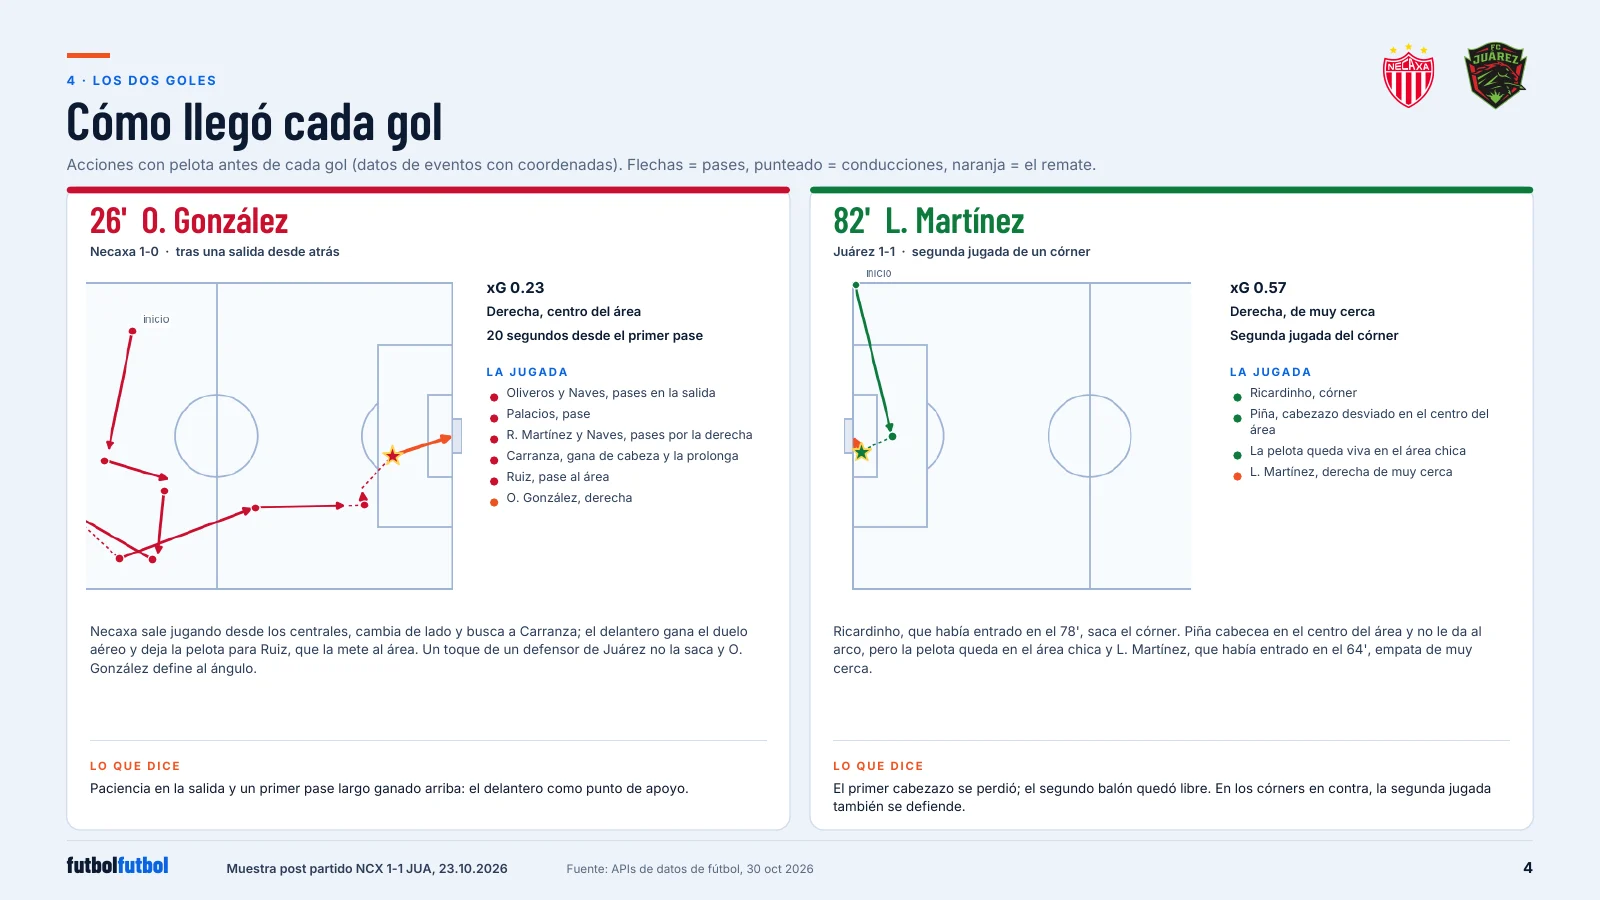
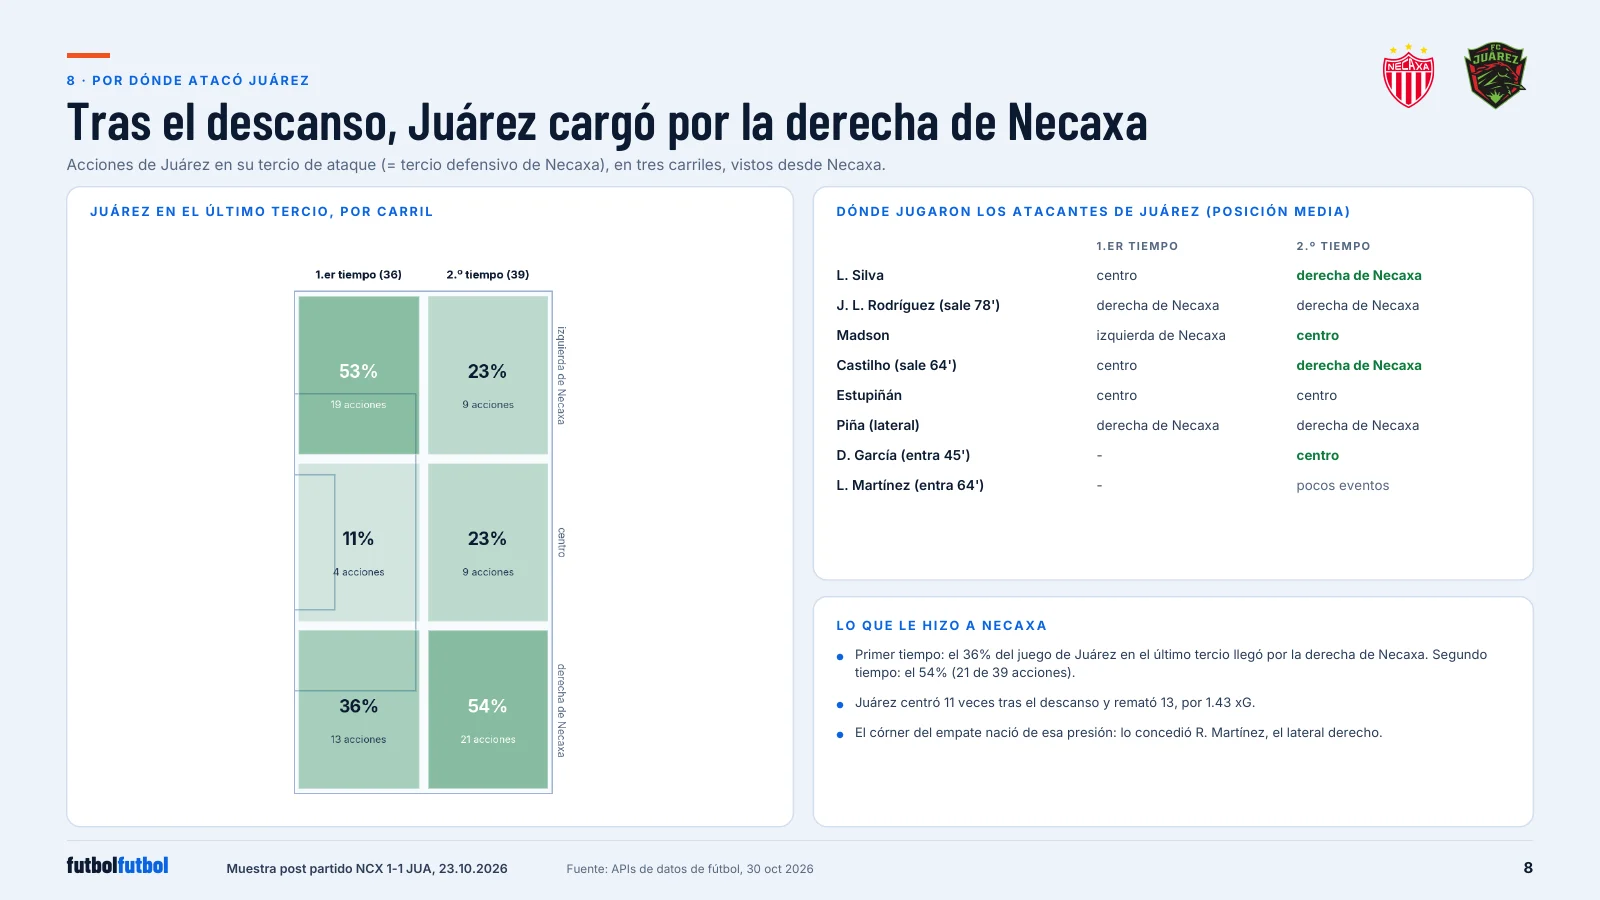
After the break Juárez led the pressure index in 36 of 54 minutes and sent 54% of its final-third play down Necaxa's right. The 82' equalizer came from a corner: Piña's header went wide and Luca Martínez scored the loose ball from close range (xG 0.57).

Inside the report

Six of the fourteen pages.
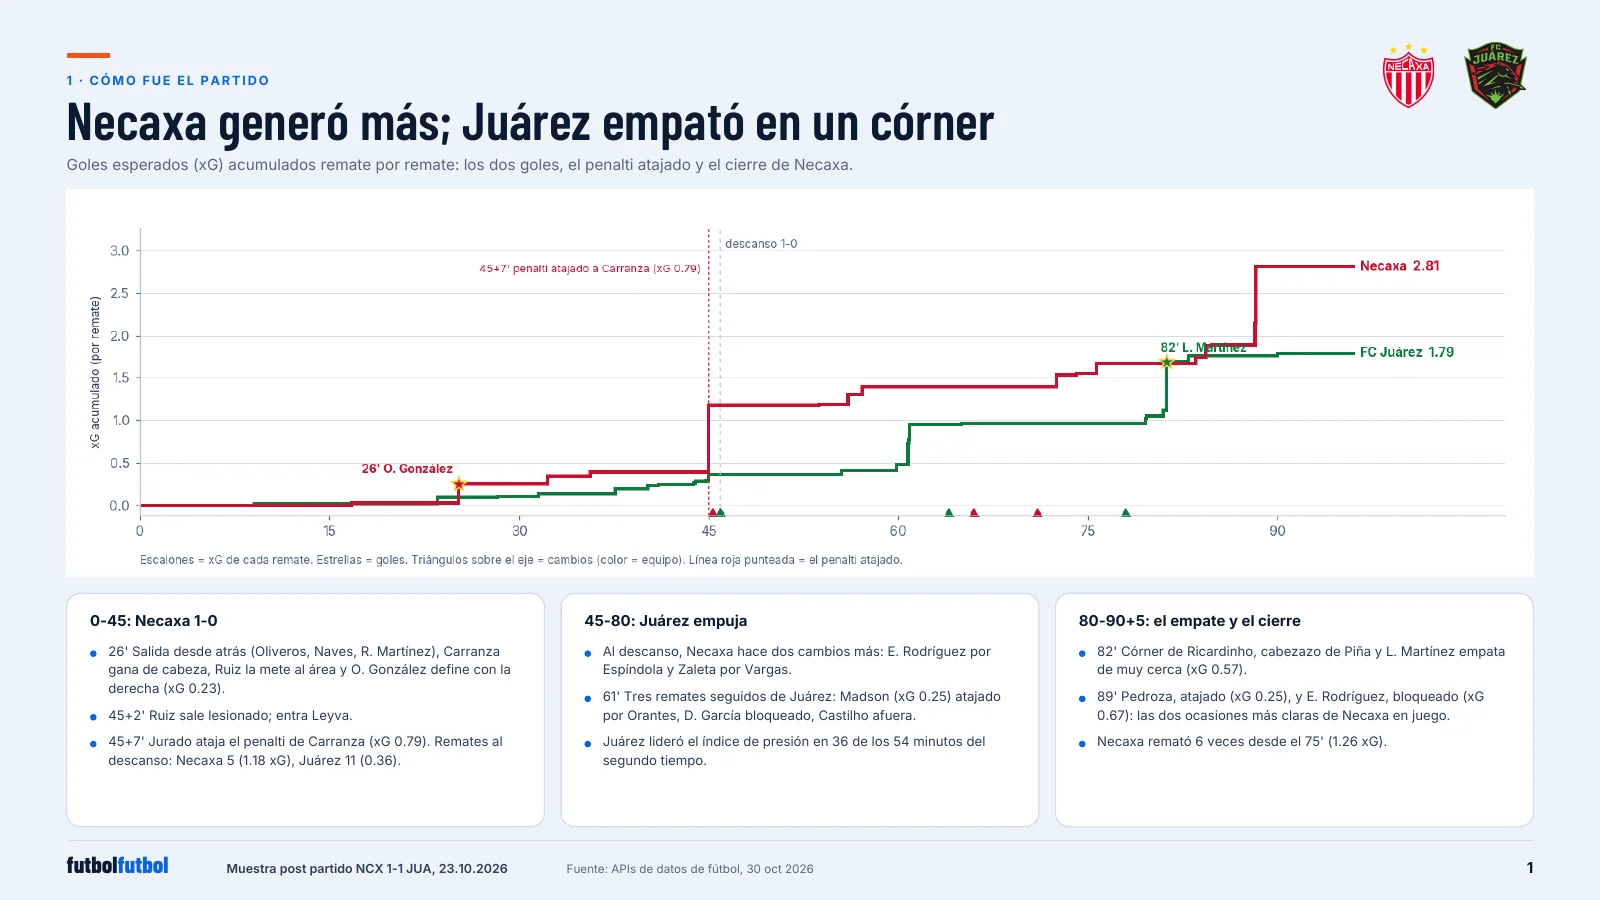
Step chart of cumulative expected goals over 90 minutes: Necaxa ends at 2.81 with a goal at 26 minutes and a dashed line at the saved penalty in first-half stoppage time, FC Juárez ends at 1.79 with its goal at 82 minutes.
How the game went. Cumulative xG shot by shot. Necaxa stayed ahead on chances all night; the saved penalty and the 89' chances are the big steps without a goal.
Shot map on a full pitch: Necaxa shots clustered inside Juárez's box on the right, Juárez shots spread around and outside Necaxa's box on the left, marker size showing xG.
Every shot. 16 shots against 24. Necaxa shot from close in; Juárez shot often from outside the box.
Two panels, one per goal, each with a pitch diagram of the passes and carries before the goal, the time from the first action, and the list of players involved.
How each goal was made. A patient build-up from the centre backs for Necaxa's goal; a corner and a loose ball in the six-yard box for Juárez's.
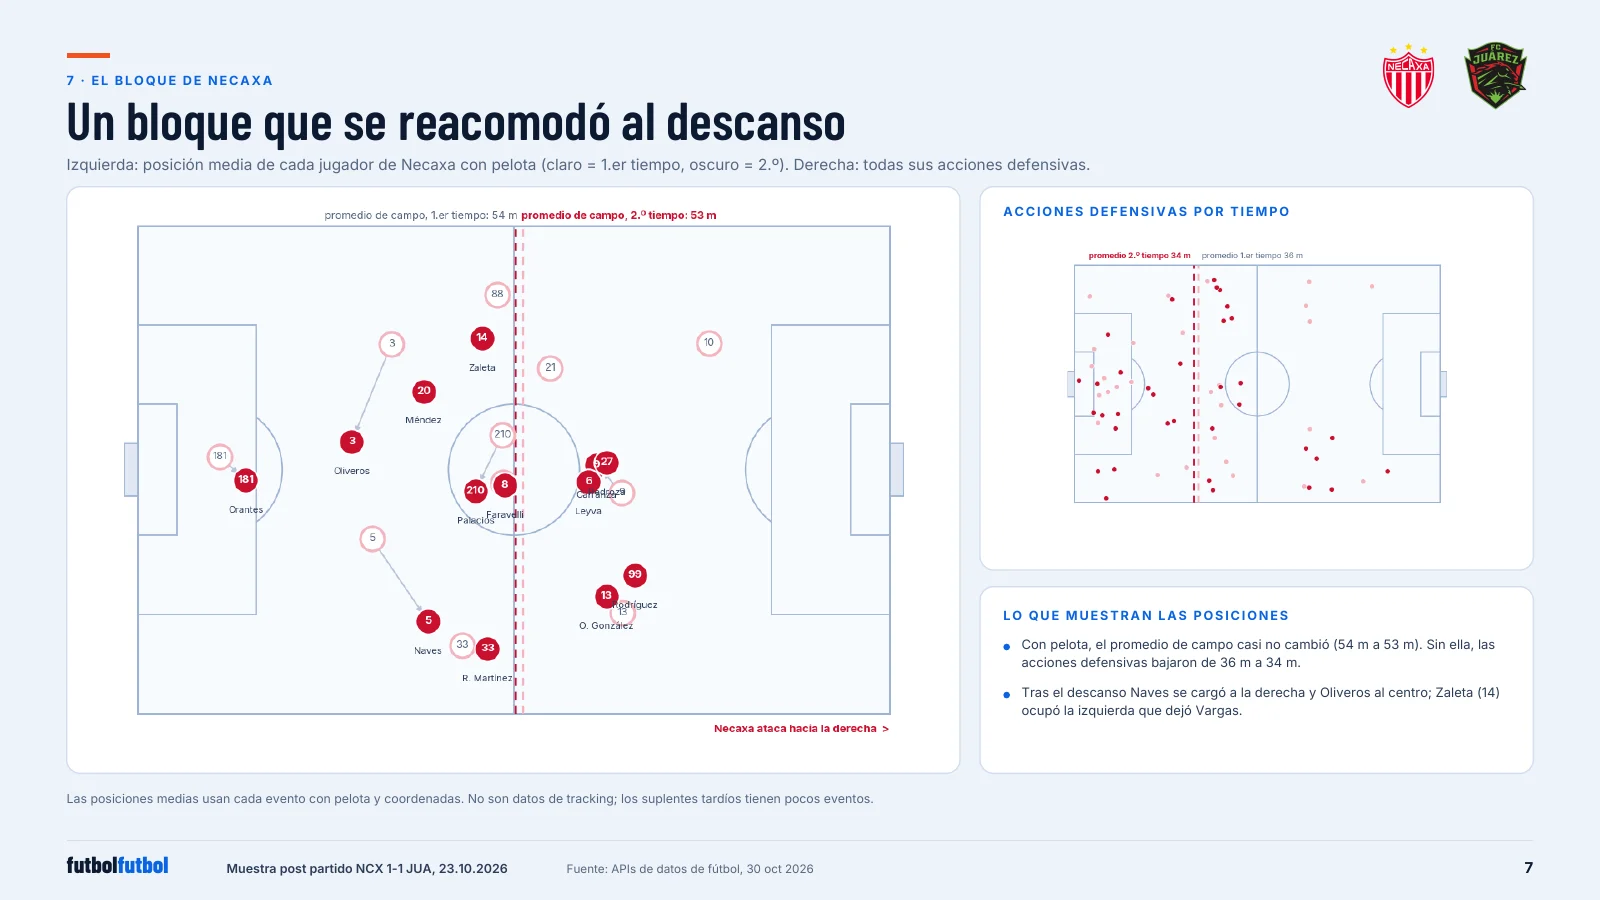
Pitch with each Necaxa player's average on-ball position in the first and second half, beside a pitch of every Necaxa tackle, interception and clearance with first and second half average lines.
Necaxa's shape. With the ball Necaxa's average position barely moved; at half-time the centre backs reshaped and a substitute took the left side.
Necaxa's defensive third split into three lanes for each half, showing 36% then 54% of Juárez actions on Necaxa's right, beside a table of where Juárez's attackers played in each half.
Juárez's push. After the break 54% of Juárez's final-third play came down Necaxa's right, up from 36%.
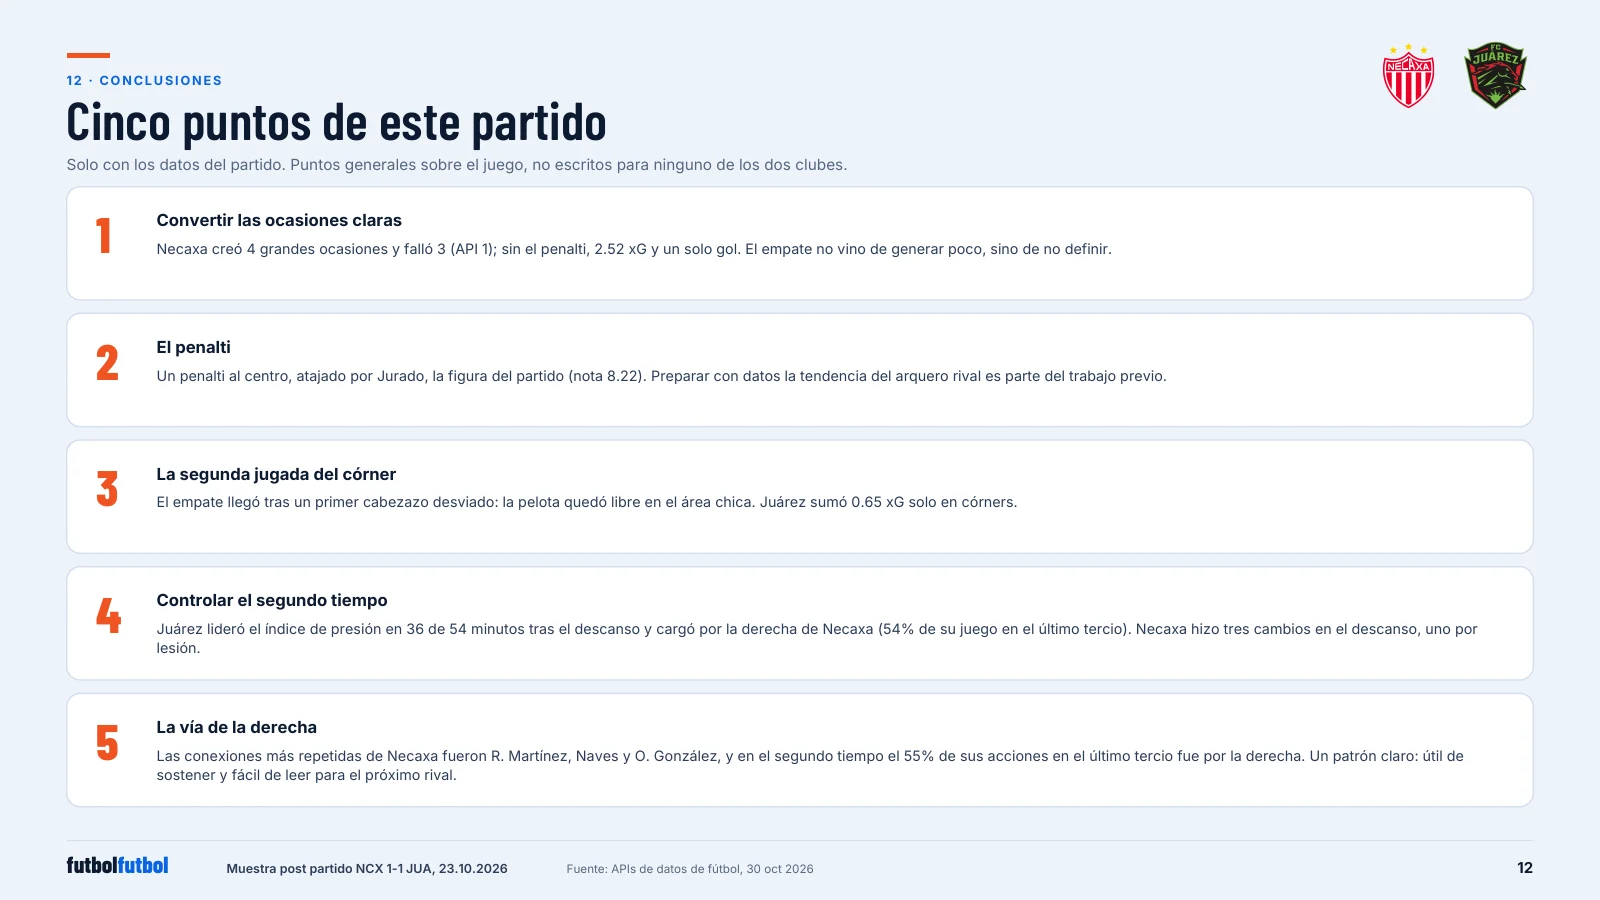
Page with five numbered cards, each giving one takeaway from the game with the numbers behind it.
Five points from this game. Finishing clear chances, the penalty, the second ball at corners, controlling the second half, and the right side as a route.

Honest about the limits

What this sample cannot show.

It uses public match data only. Positions come from on-ball events, not tracking, so players off the ball are not seen. Different data services give different numbers; the report shows them side by side and says which one it uses.

With a club's own statistics, GPS and match video, the same report adds tracking, physical load and drawn clips.

Data usedPublic match events, team and player statistics.
DeliveredThe day after the game, as a 14-page report.
With a clubPlus the club's statistics, GPS (XML or CSV) and video, and live notes on match day.

See it on one of your own games.

We send a sample report built on one of your recent games.

Request a sample report