
Sample work - Nashville SC 3-2 Red Bull New York
Nashville SC 3-2 Red Bull New York
Sample work: pages from a 24-page post-match report on Nashville SC 3-2 Red Bull New York (MLS, 1 November 2026), built only from public match data a few hours after the game. It reads the match by the four phases of play and three pitch zones, with shots, goals, set pieces, players and what the match suggests for the next opponent.
What the report showed
Three points from the numbers.
From 0-2 to 3-2
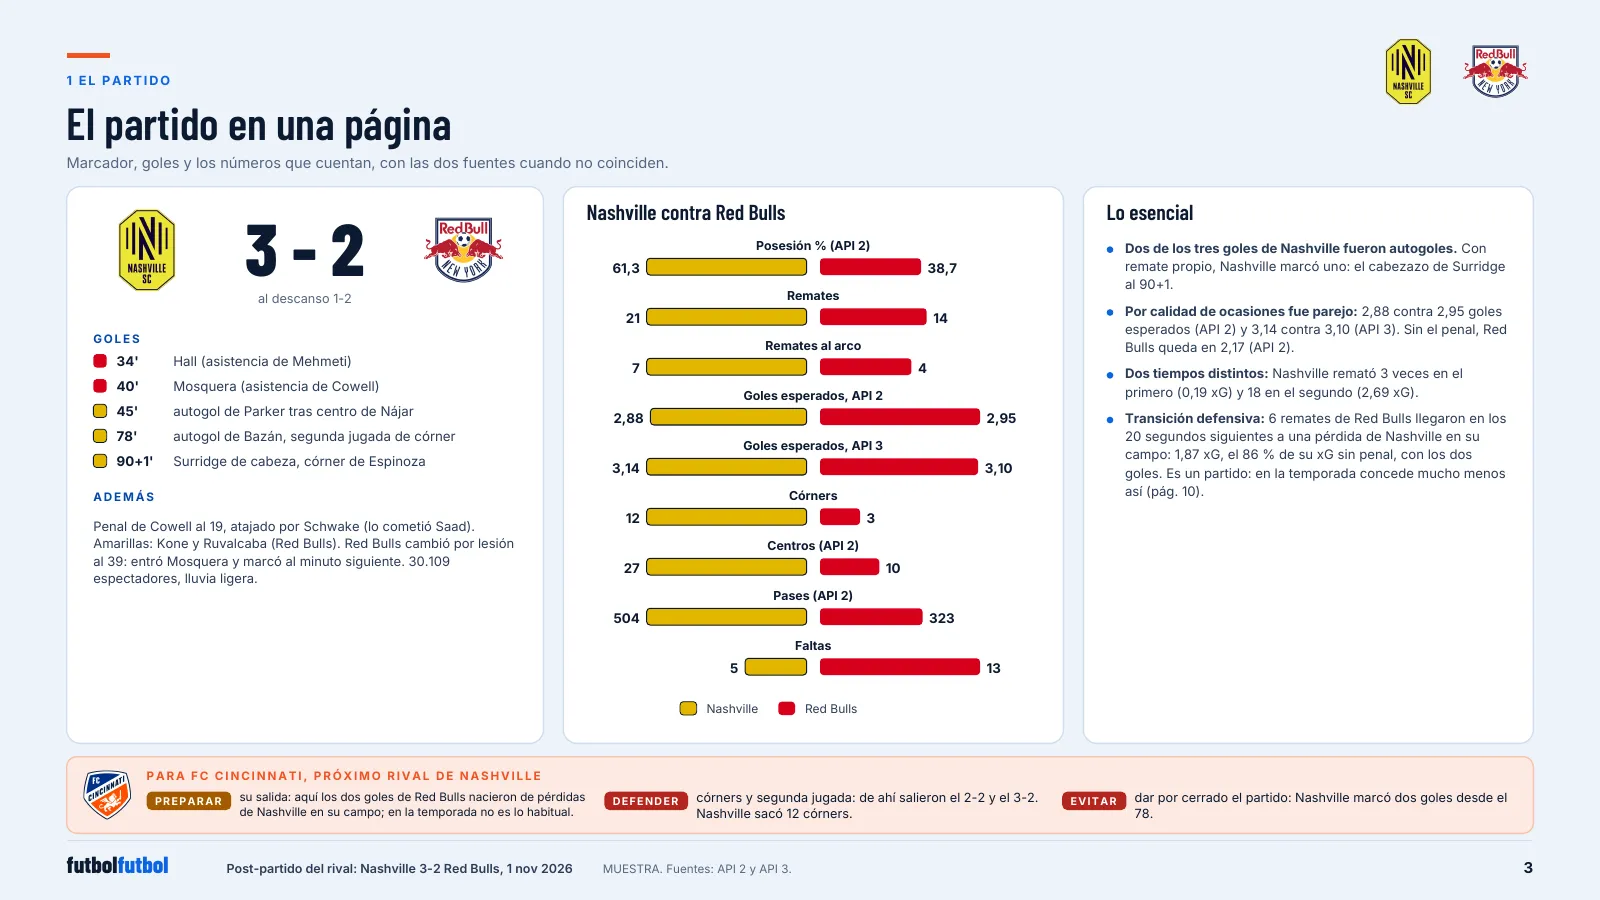
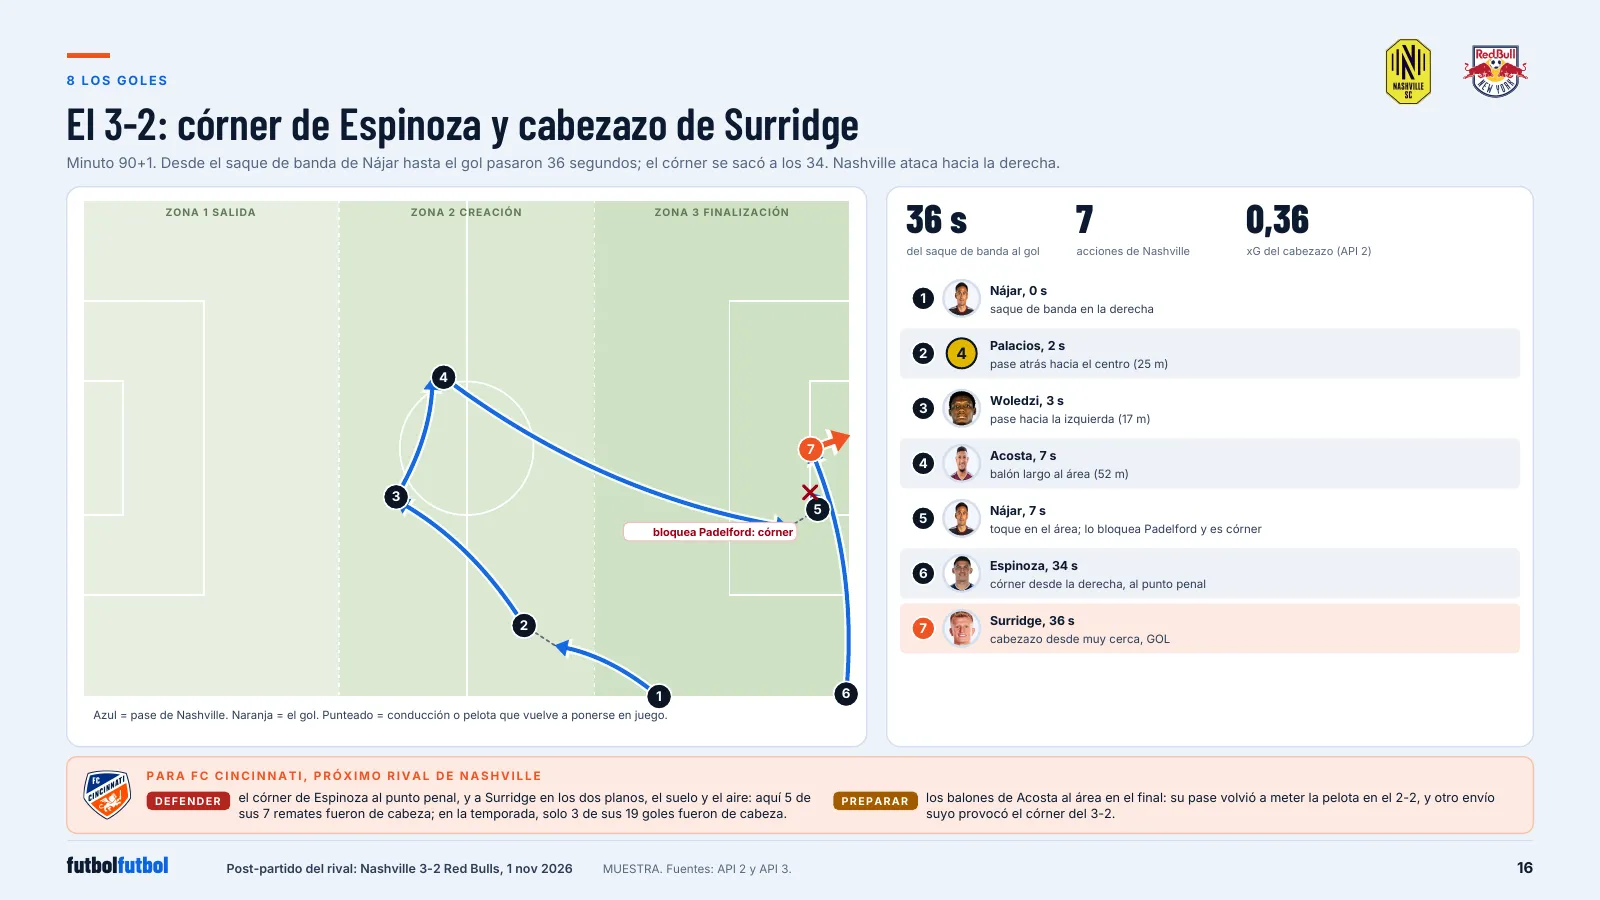
Red Bull New York led 2-0 at 40 minutes. Two own goals (45 and 78 minutes) levelled it, and Surridge headed the winner at 90+1 from an Espinoza corner.
Close to even, with Nashville on the corners
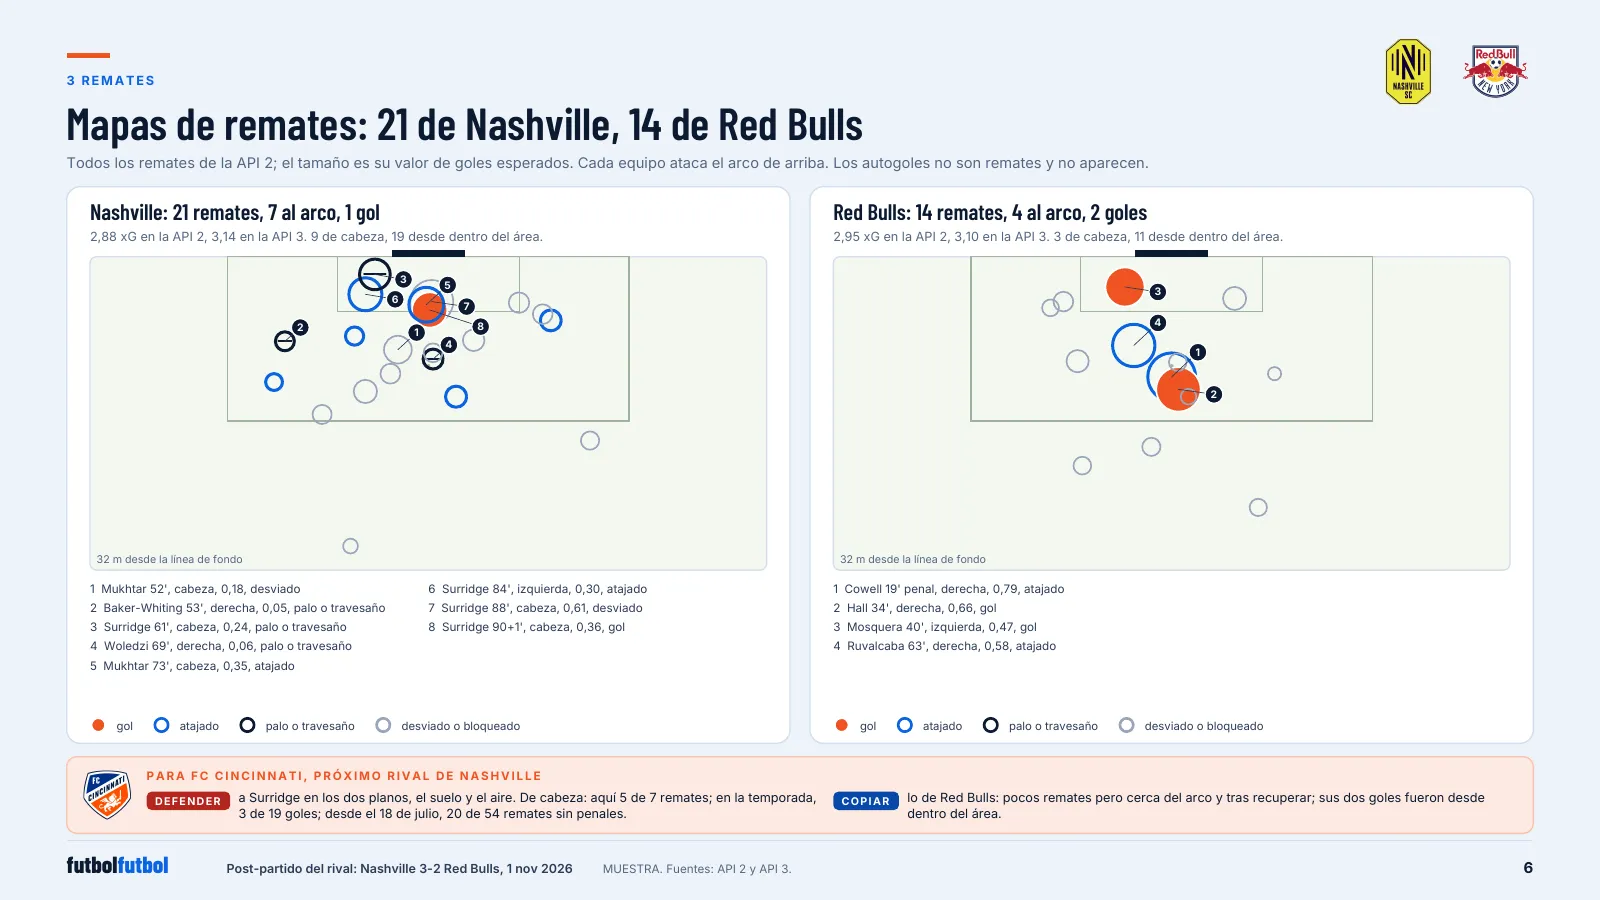
Expected goals were 2.88 to 2.95 on one data feed and 3.14 to 3.10 on the other. Nashville had 12 corners to 3 and 27 crosses to 10.
A transition spell that does not repeat
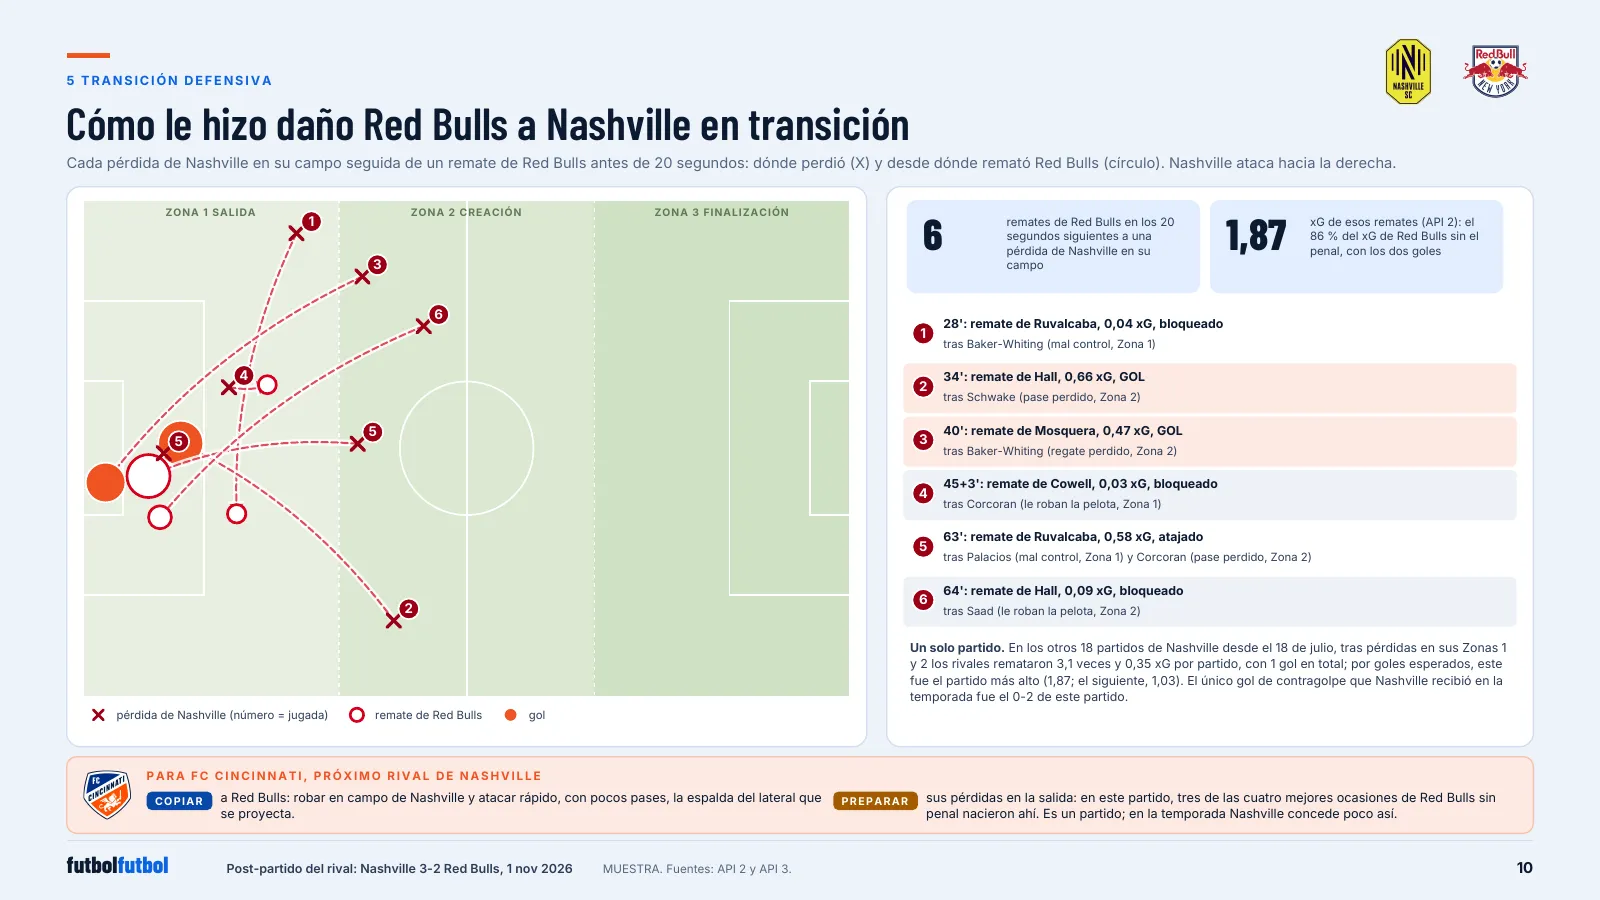
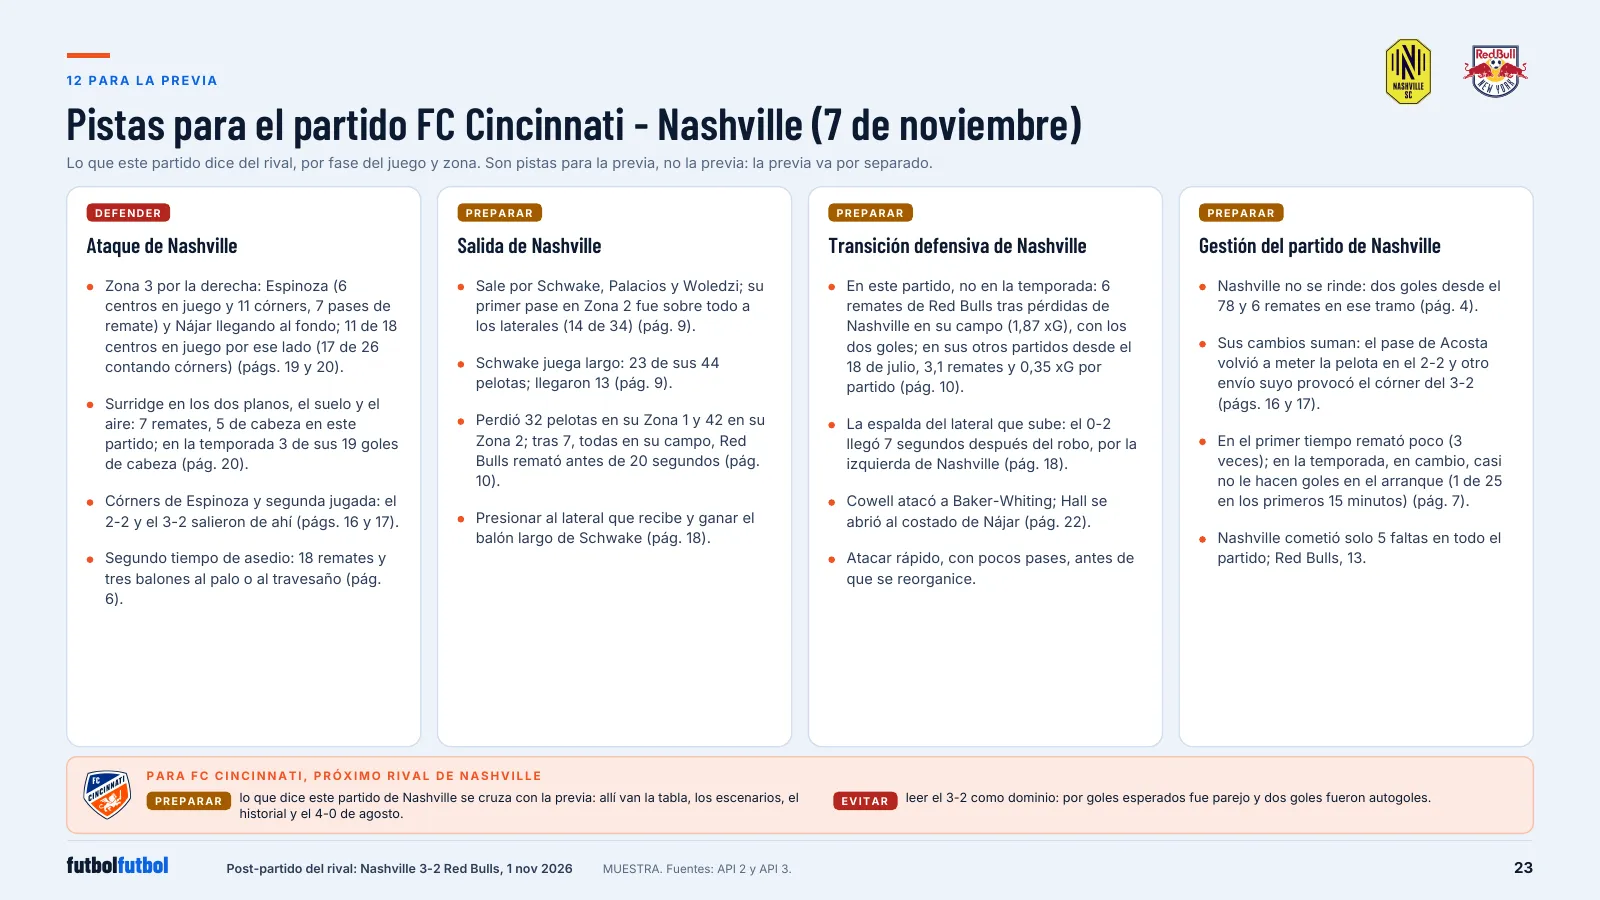
Red Bulls had 6 shots within 20 seconds of Nashville losing the ball in its own zones. In the other 18 games since July it produced one goal, so the report treats it as one match to prepare for, not a pattern.
Inside the report
Six of the 24 pages.
The report was written in Spanish, so its pages are shown in Spanish.
Honest about the limits
What this sample cannot show.
It uses public match data only. Positions come from on-ball events, not tracking, so players off the ball are not seen. Different data services give different expected goals; the report shows both side by side and does not treat either as the true value. Every figure is marked as direct data, an estimate, or something that needs match video.
With a club's own statistics, GPS and match video, the same report adds tracking, physical load and drawn clips.
See it on one of your own games.
We send a sample report built on one of your recent games.