
Sample work · Nashville SC vs Red Bull New York
Nashville SC vs Red Bull New York
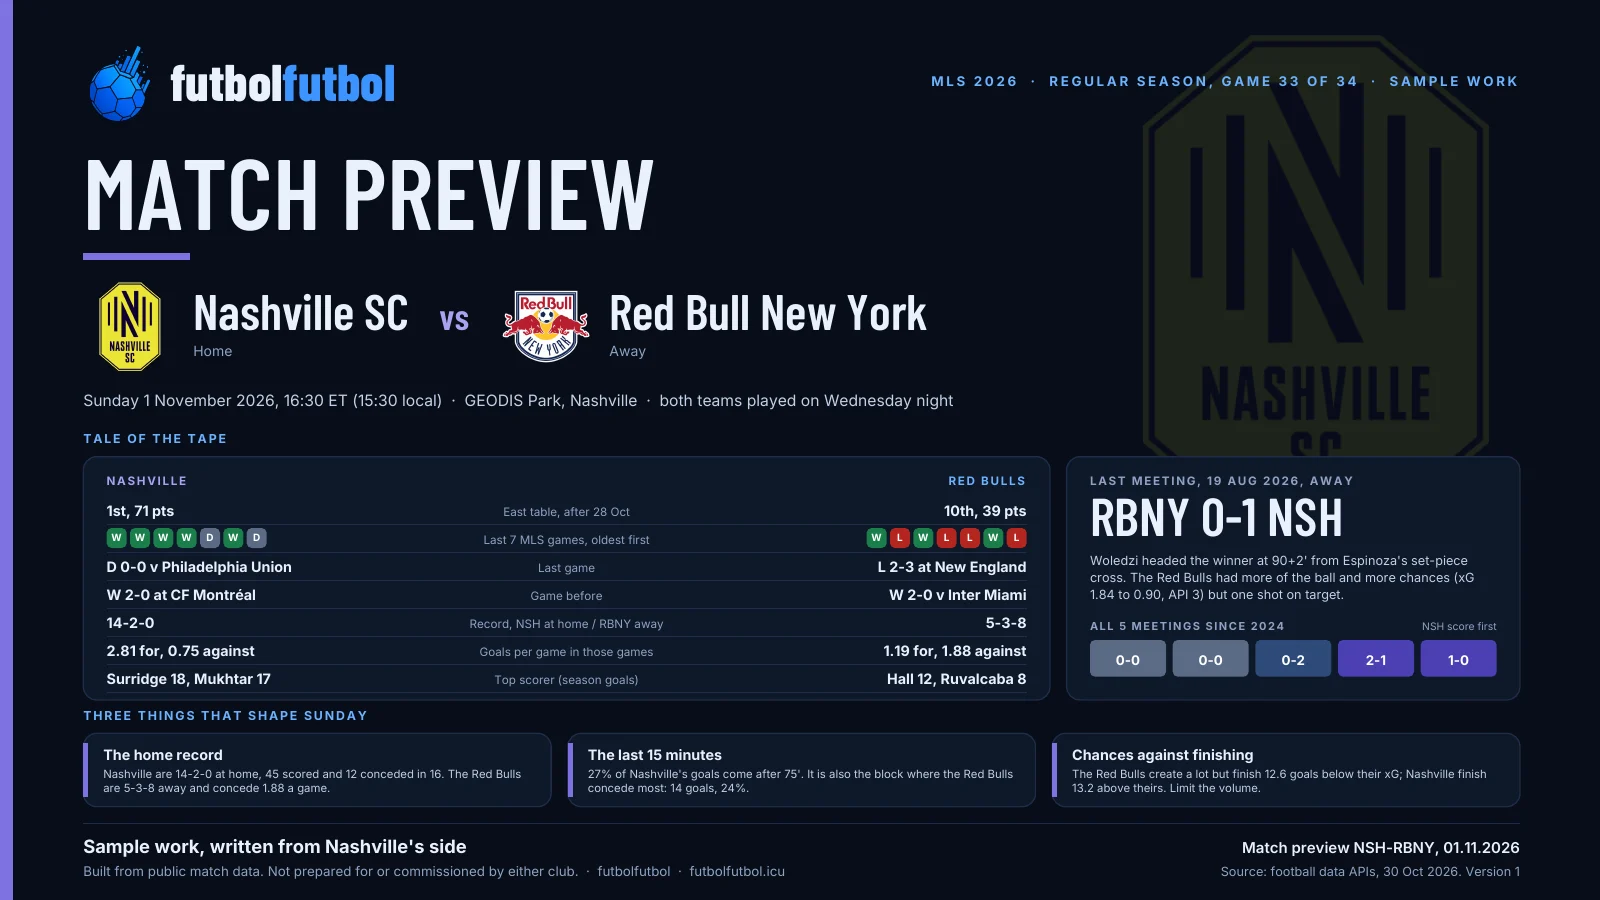
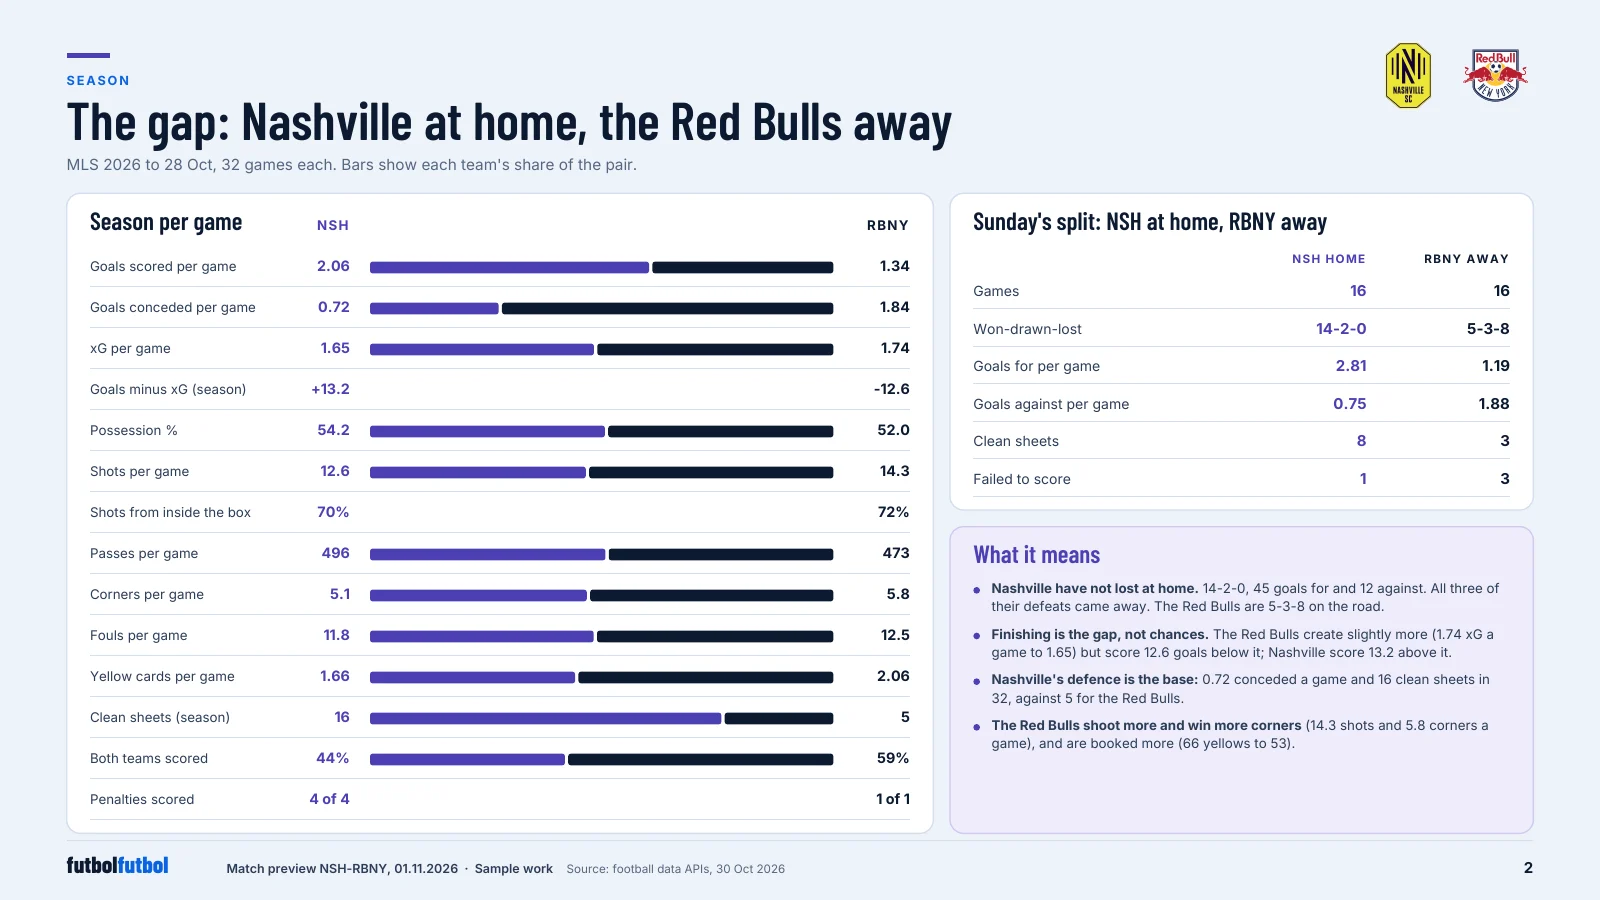
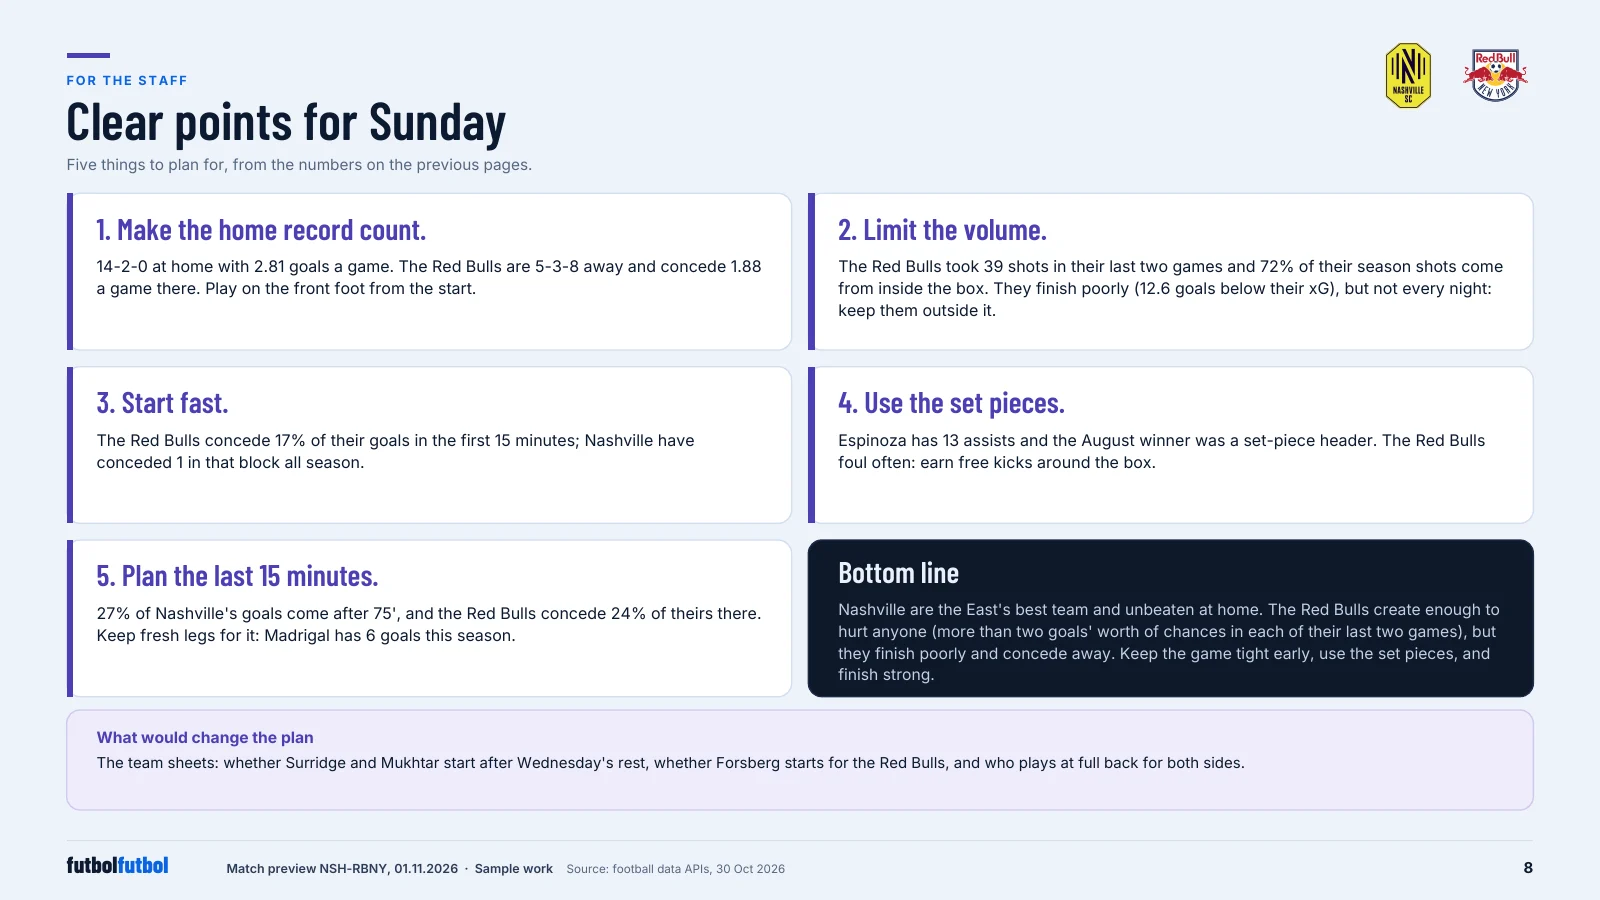
Sample work: pages from a 9-page pre-game report on Nashville SC vs Red Bull New York (MLS, 1 Nov 2026), built only from public data, with the focus on Nashville SC. Expect Nashville to control the game at home: they are 14-2-0 at GEODIS Park with 2.81 goals a game, while the Red Bulls are 5-3-8 away and concede 1.88 a game there. Plan for a visitor that shoots often but finishes poorly (12.6 goals below its xG this season), and for a decisive last 15 minutes, where 27% of Nashville's goals come.
What the staff should plan for
Three points to prepare before kick-off.
A home record built to start fast
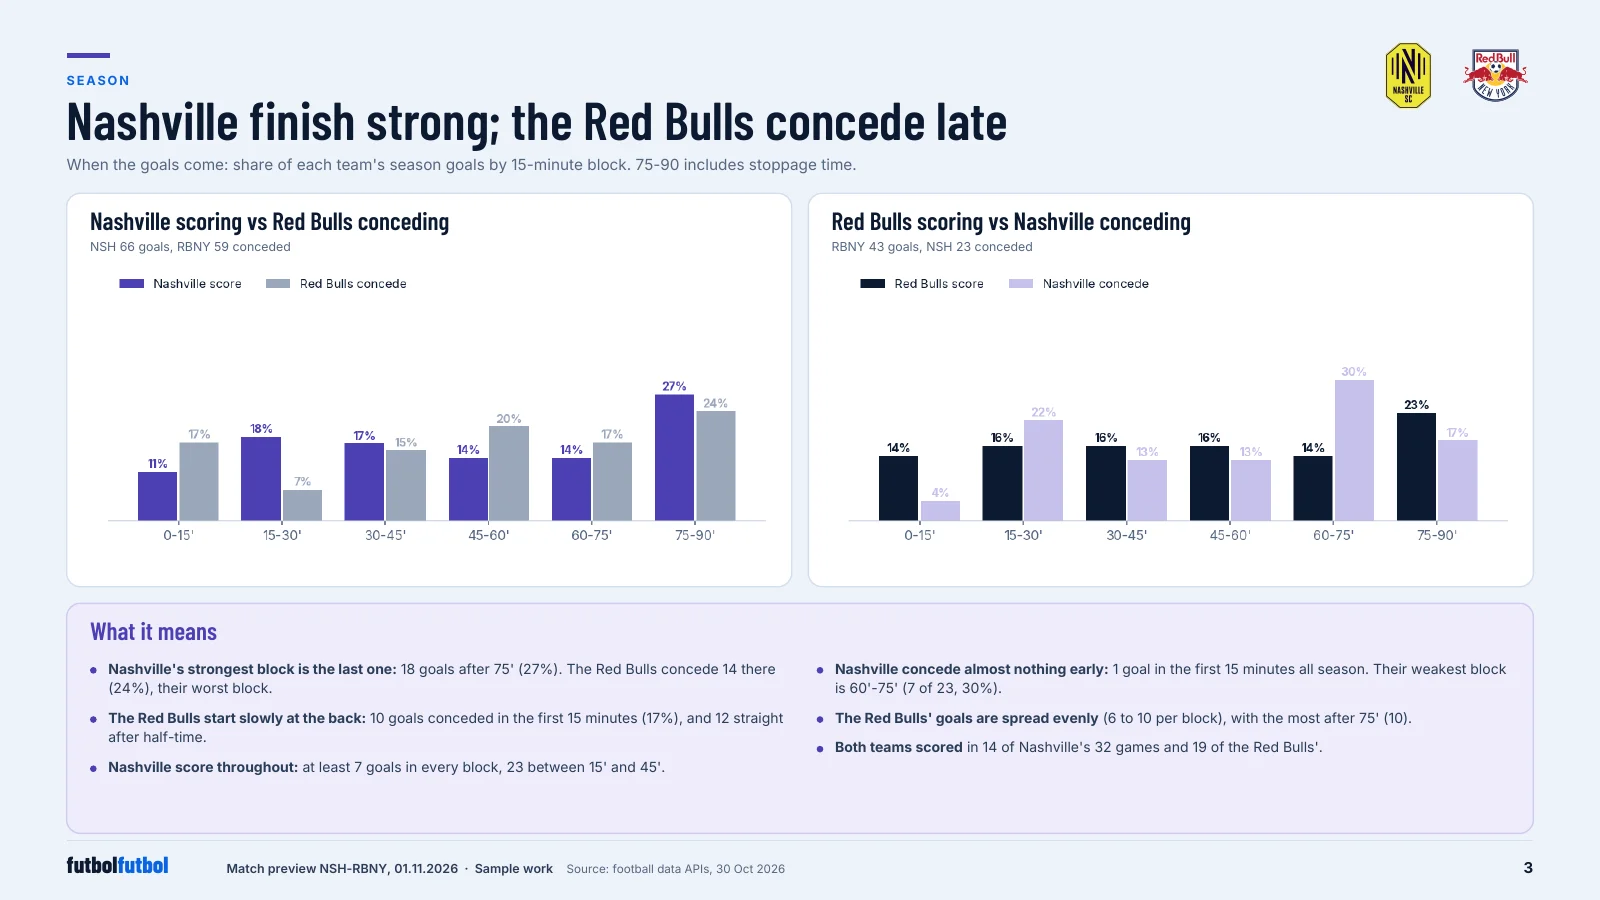
Nashville are unbeaten at home (14-2-0, 45 scored, 12 conceded) and have conceded 1 goal in the first 15 minutes all season. The Red Bulls concede 17% of their goals in that opening block. Plan to press high from the start.
Limit the volume, not just the danger
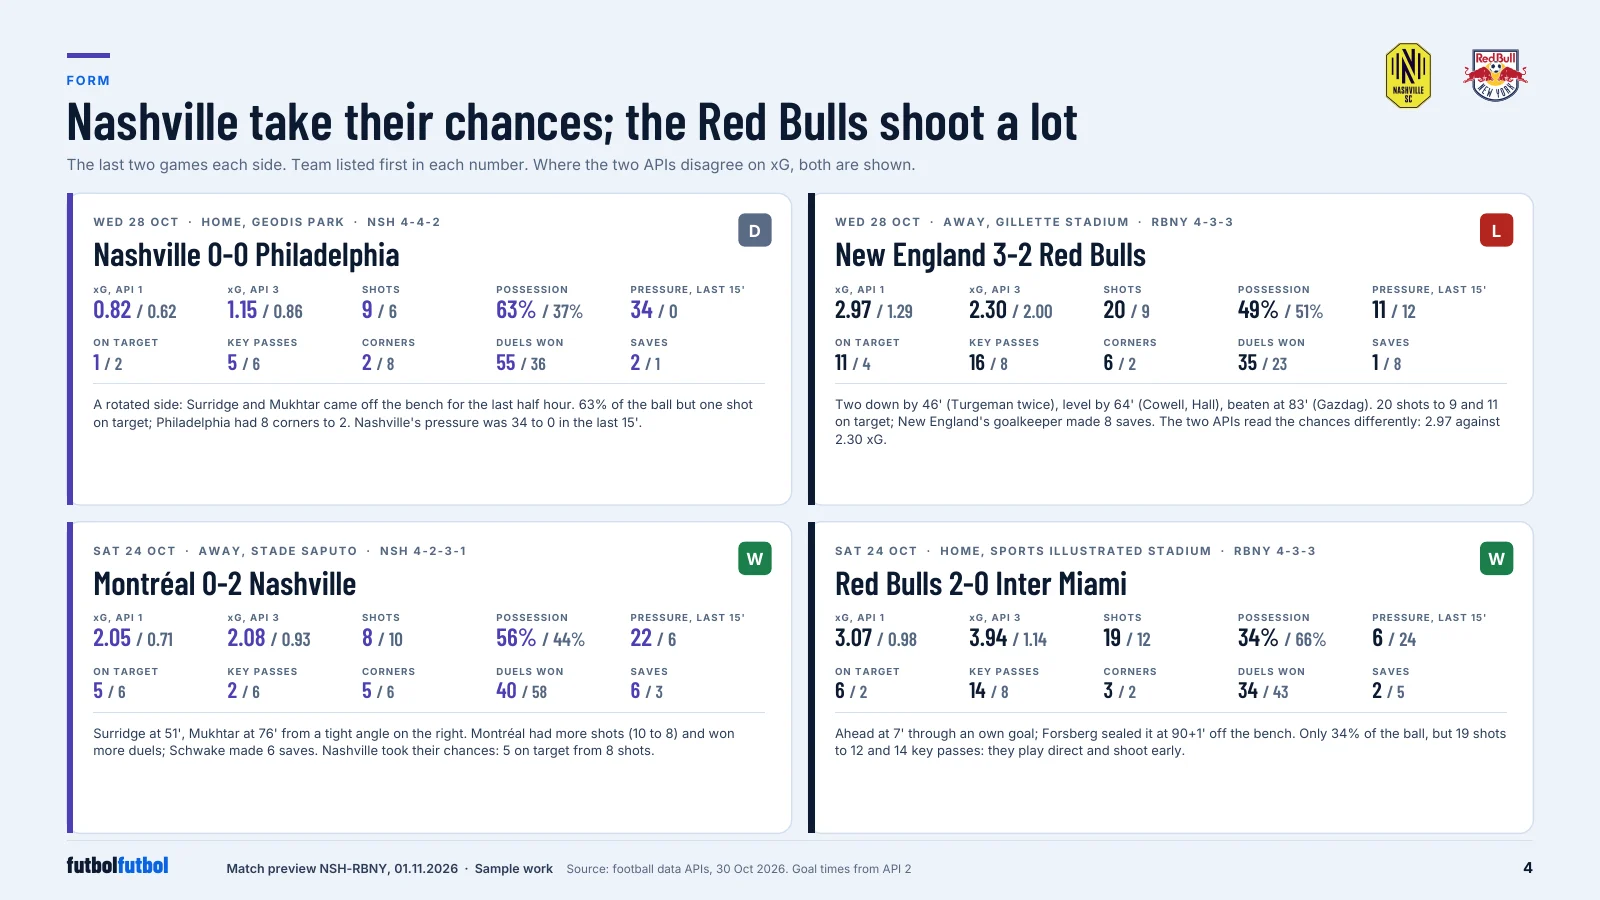
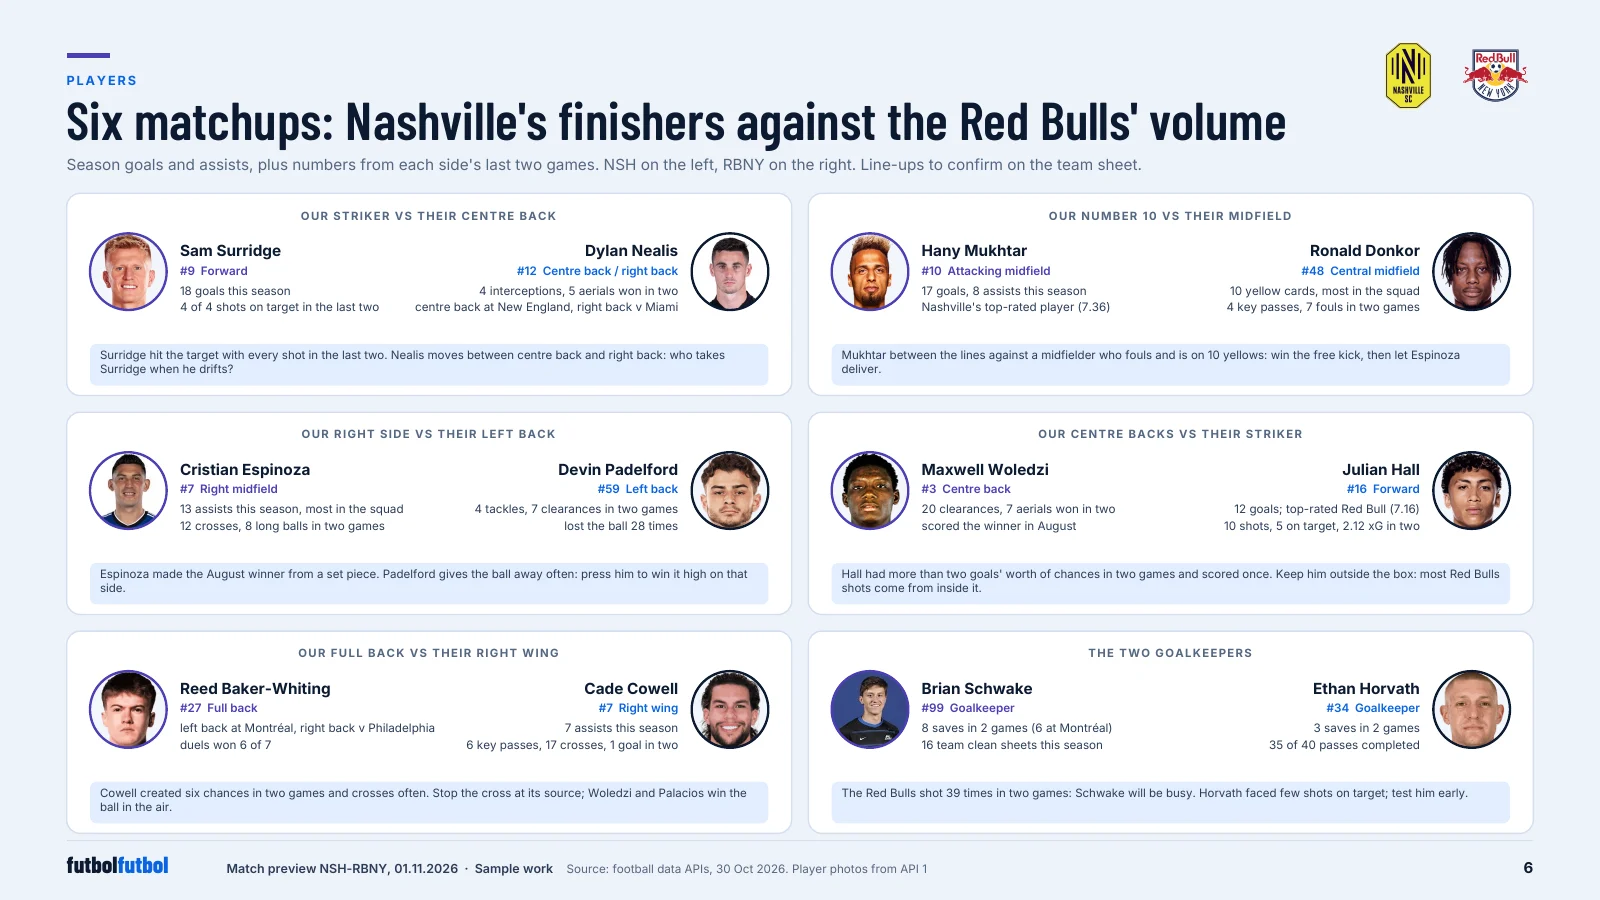
The Red Bulls took 39 shots in their last two games and 72% of their season shots come from inside the box. They finish 12.6 goals below their xG, but created more than two goals' worth of chances in each of the last two. Keep Hall and Cowell outside the box.
Set pieces and fresh legs late
27% of Nashville's goals come after 75', the block where the Red Bulls concede most (24%). The August meeting was won 1-0 at 90+2' by a set-piece header. Plan the substitutions and Espinoza's deliveries (13 assists) for the end.
Inside the report
Six of the nine pages.
Honest about the limits
What this sample cannot show.
It uses public match data only. Positions come from on-ball events, not tracking, so players off the ball are not seen. Different data services give different numbers; the report shows them side by side and says which one it uses.
With a club's own statistics, GPS and match video, the same report adds tracking, physical load and drawn clips.
See it on one of your own games.
We send a sample report built on one of your recent games.