
Sample work · Charlotte FC 4-0 Orlando City SC
Charlotte FC 4-0 Orlando City SC
Sample work: pages from a 23-page post-match report on Charlotte FC 4-0 Orlando City SC (MLS, 31 October 2026), built only from public match data after the game. It covers shots and chance quality, goalkeeping, players, substitutions, the red card, scenarios, and how our pre-match forecast compared with the result. It was not prepared for, or with, either club.
What the match showed
Three points from the numbers.
Better chances, and finishing that ran ahead
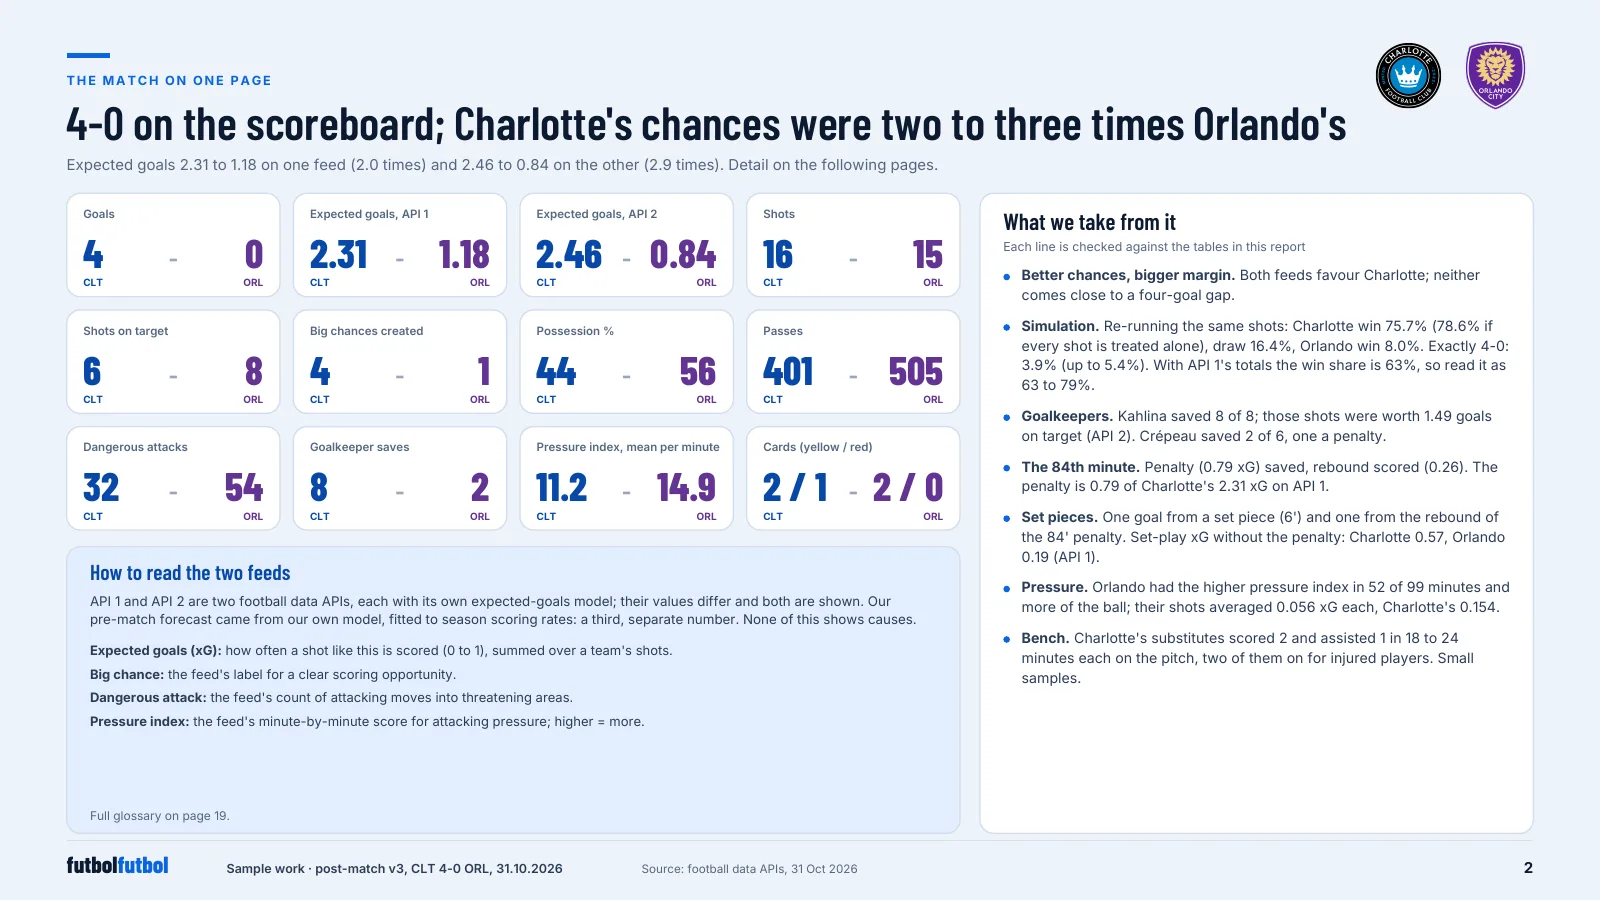
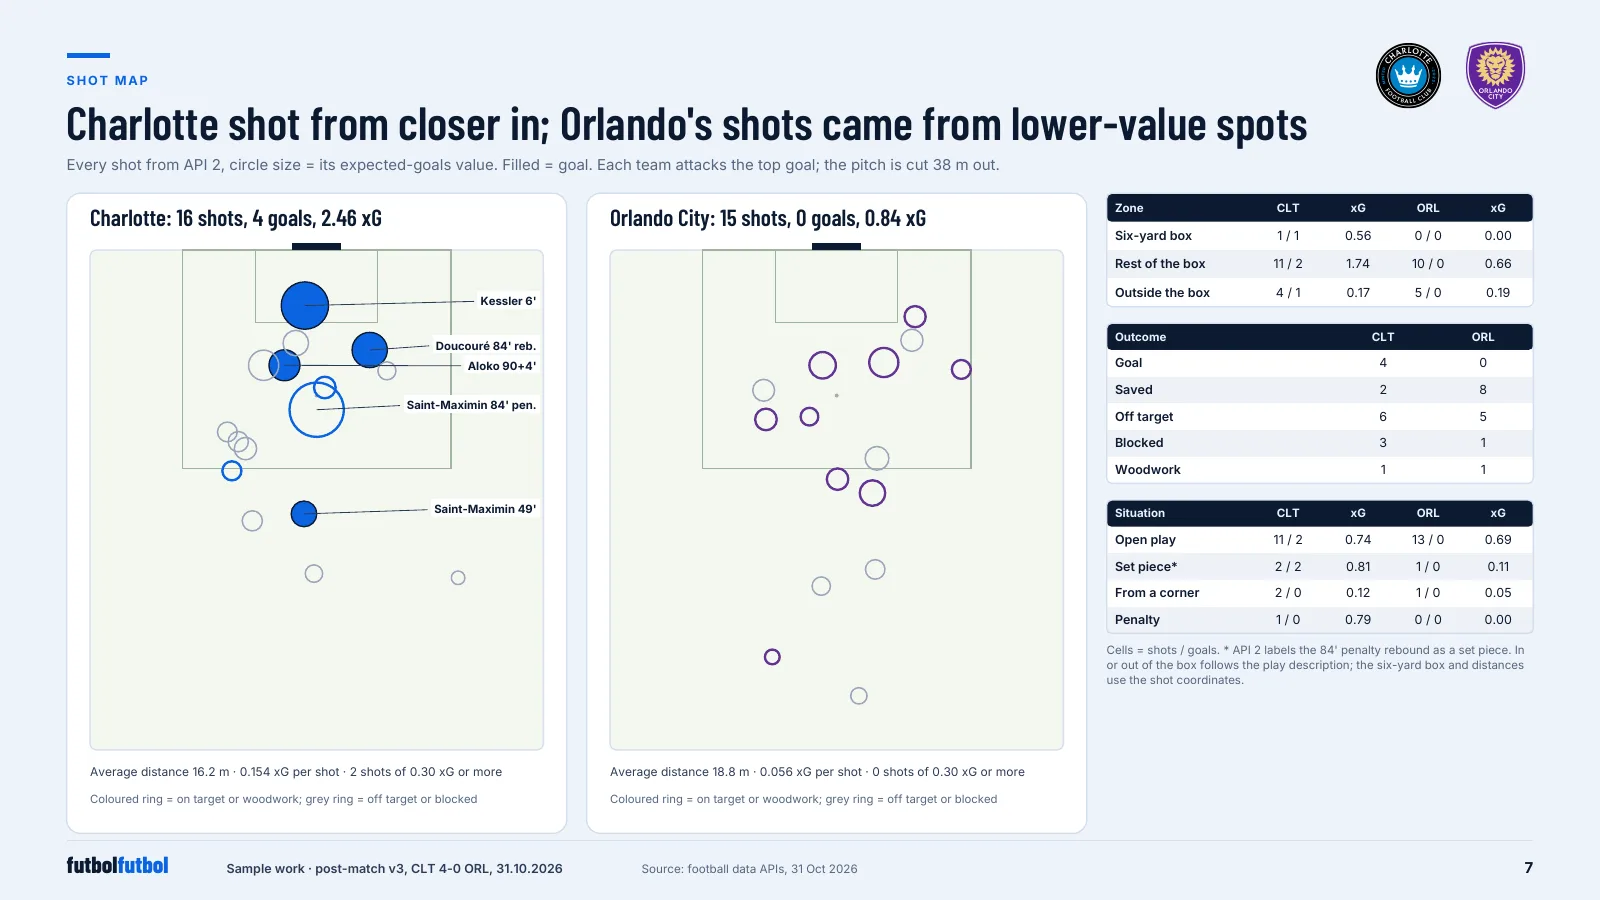
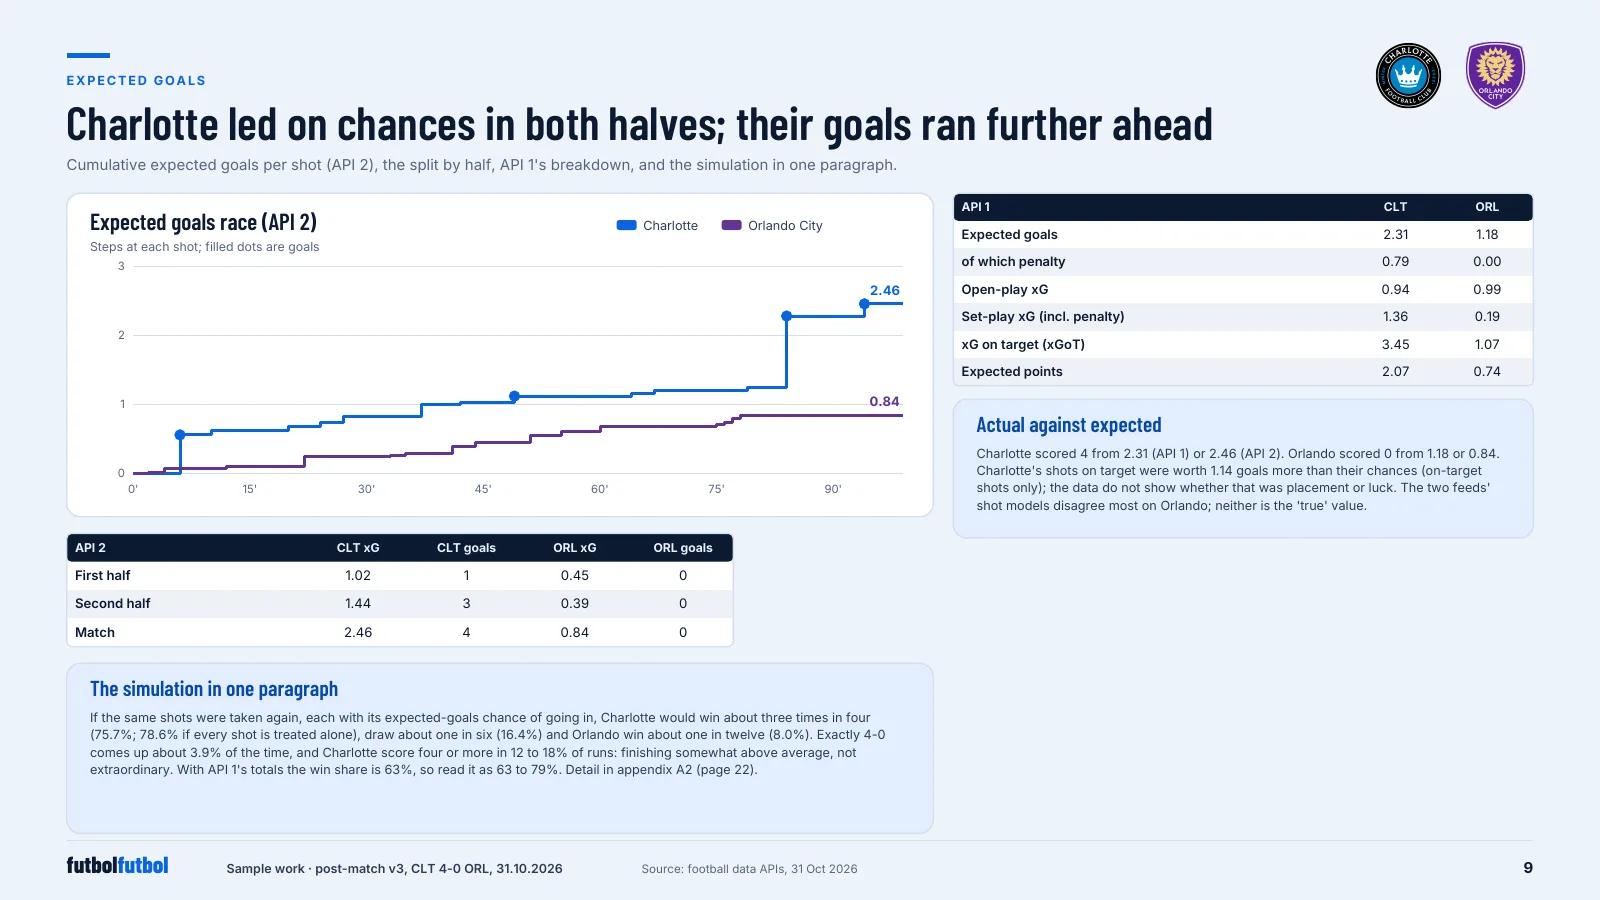
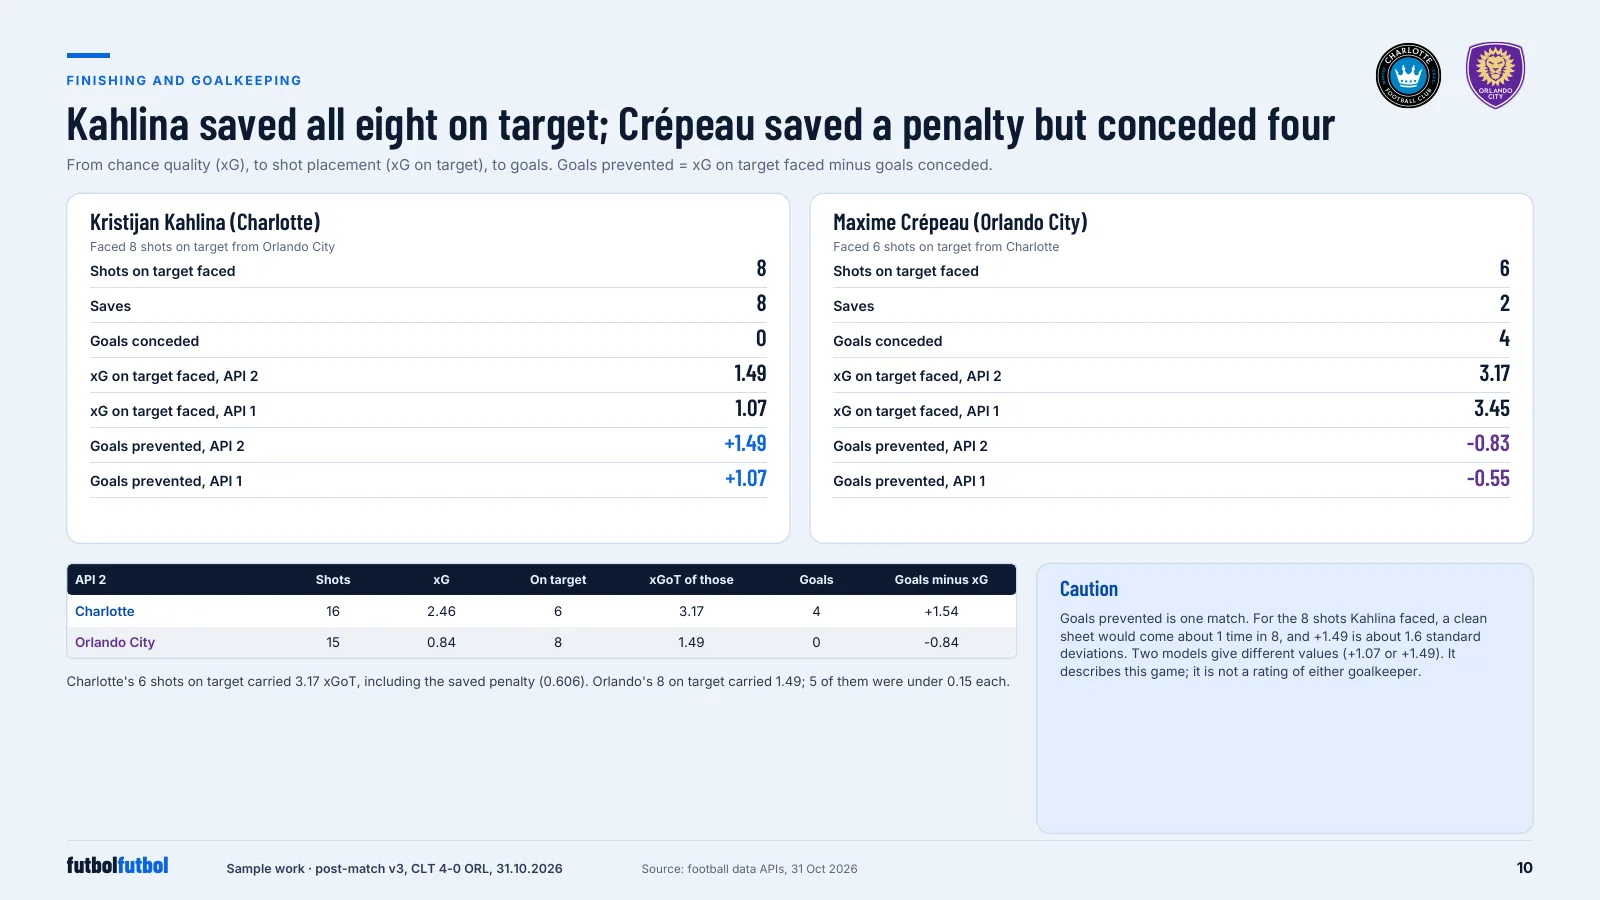
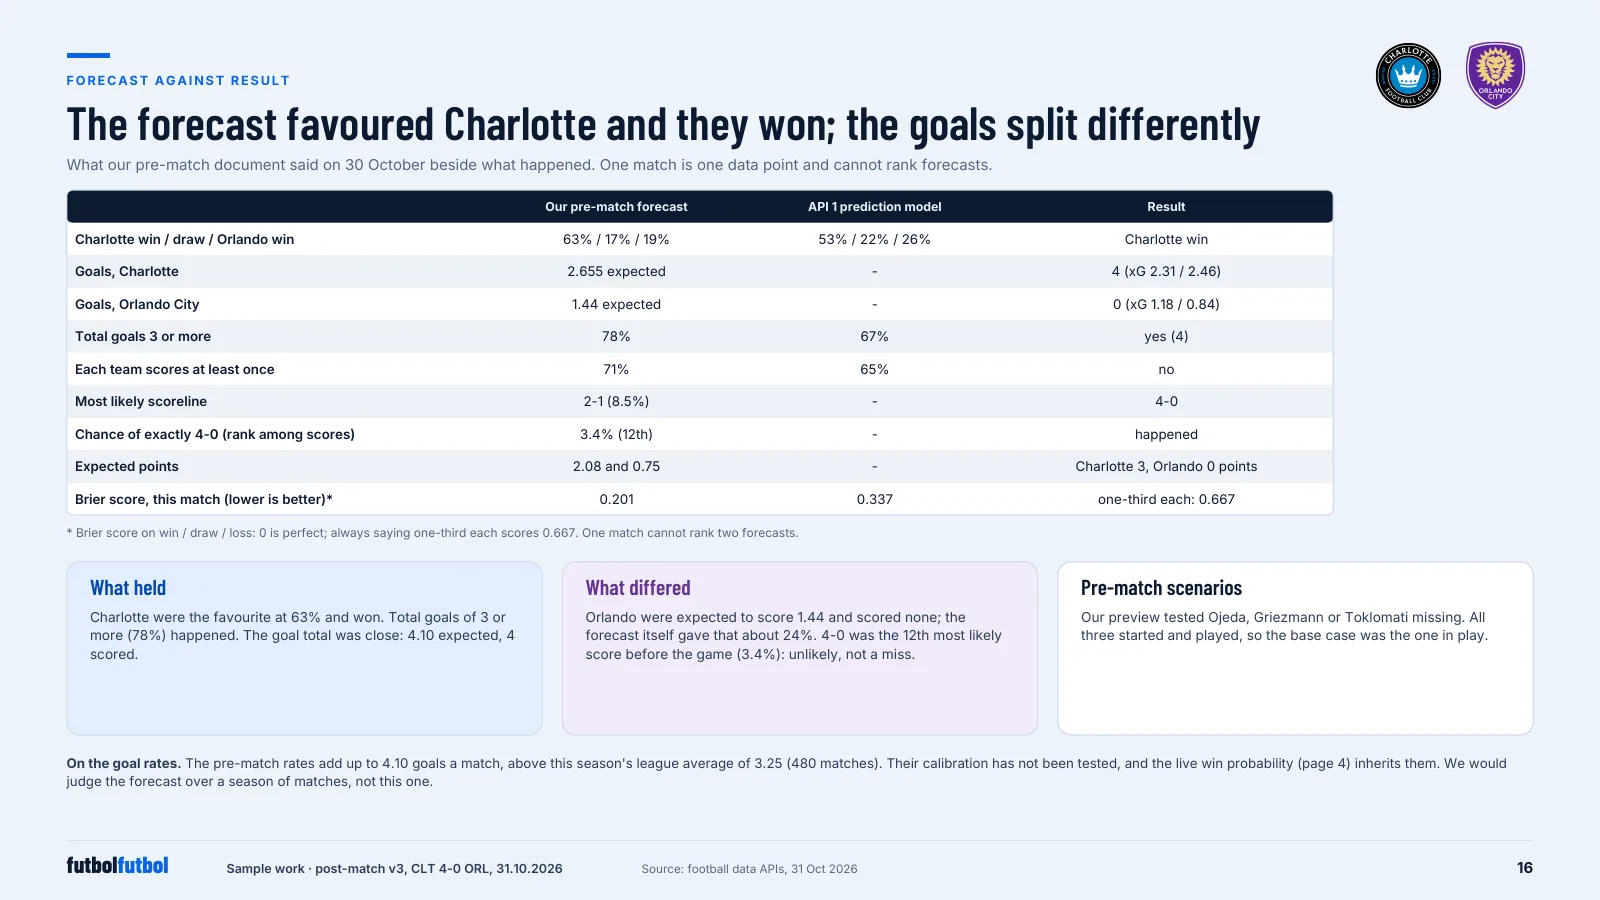
Charlotte's chances were worth 2.31 or 2.46 expected goals on the two data feeds, against 1.18 or 0.84 for Orlando. Charlotte scored 4. Orlando put 8 of its 15 shots on target and scored none: Kahlina saved all eight.
One attack carried much of the edge
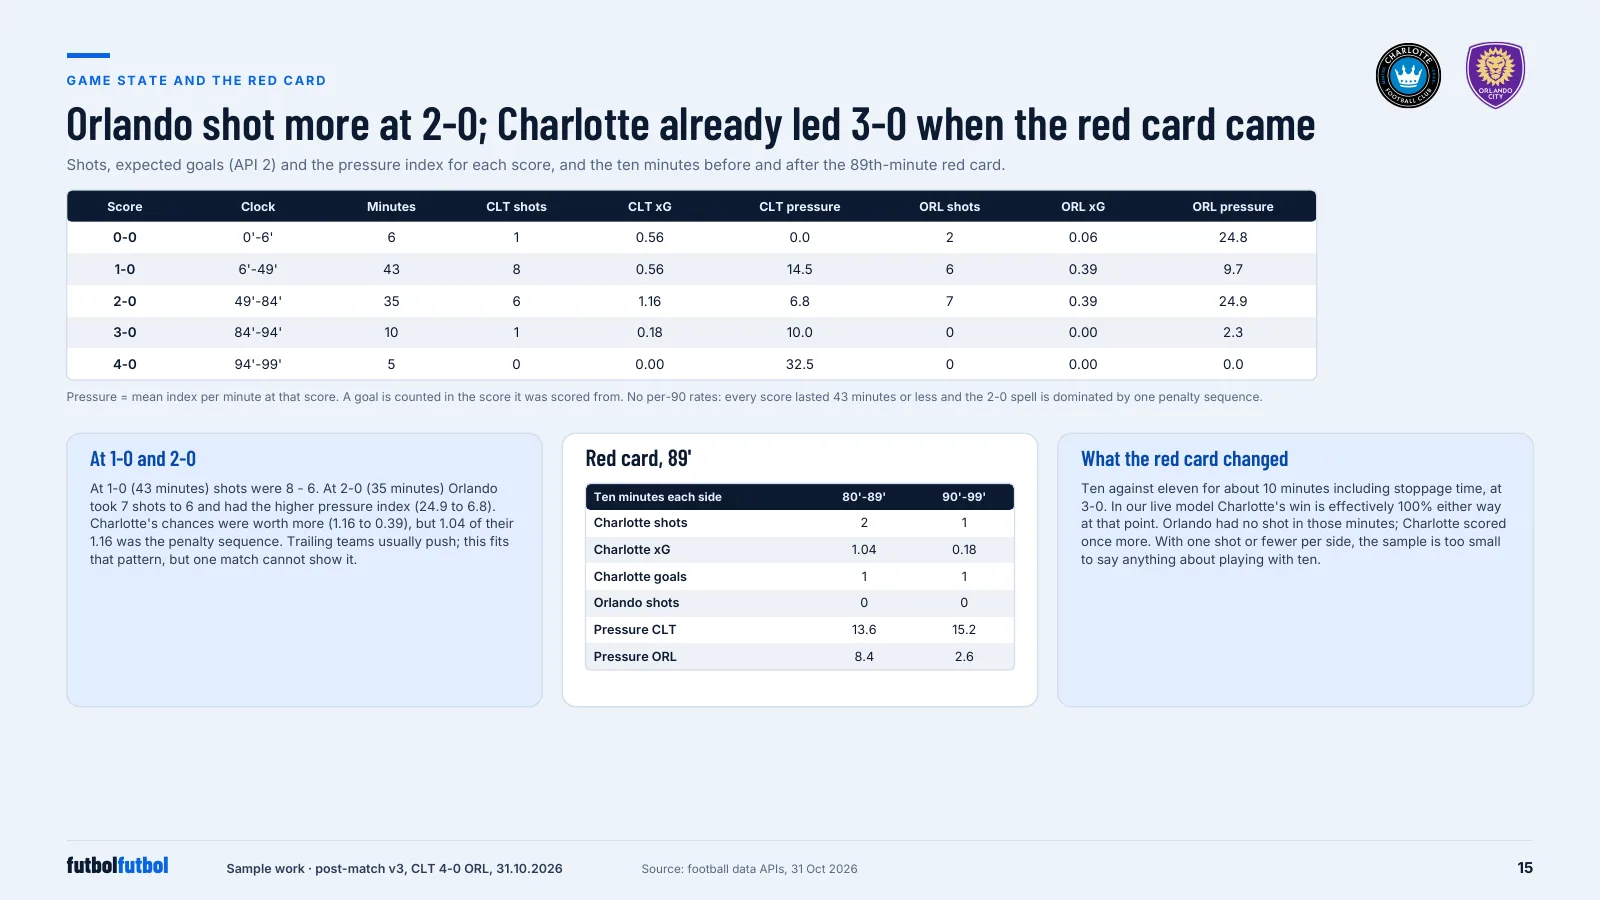
A penalty won at 82' was saved and the rebound scored at 84'. As one attack it was worth at most 84% of a goal. Re-running the same shots without it, Charlotte's win share falls from 78.6% to 52.5%.
What the pre-match numbers said, and what they cannot say
Our pre-match forecast gave Charlotte 63%, the draw 17% and Orlando 19%, and Charlotte won. It expected 4.1 goals and there were 4. A 4-0 was a 3.4% scoreline, so one match proves nothing either way.
Inside the report
Six of the 23 pages.
Honest about the limits
What this sample cannot show.
It uses public match data only. Positions come from on-ball events, not tracking, so players off the ball are not seen. Different data services give different expected goals; the report shows both side by side and does not treat either as the true value.
With a club's own statistics, GPS and match video, the same report adds tracking, physical load and drawn clips.
See it on one of your own games.
We send a sample report built on one of your recent games.