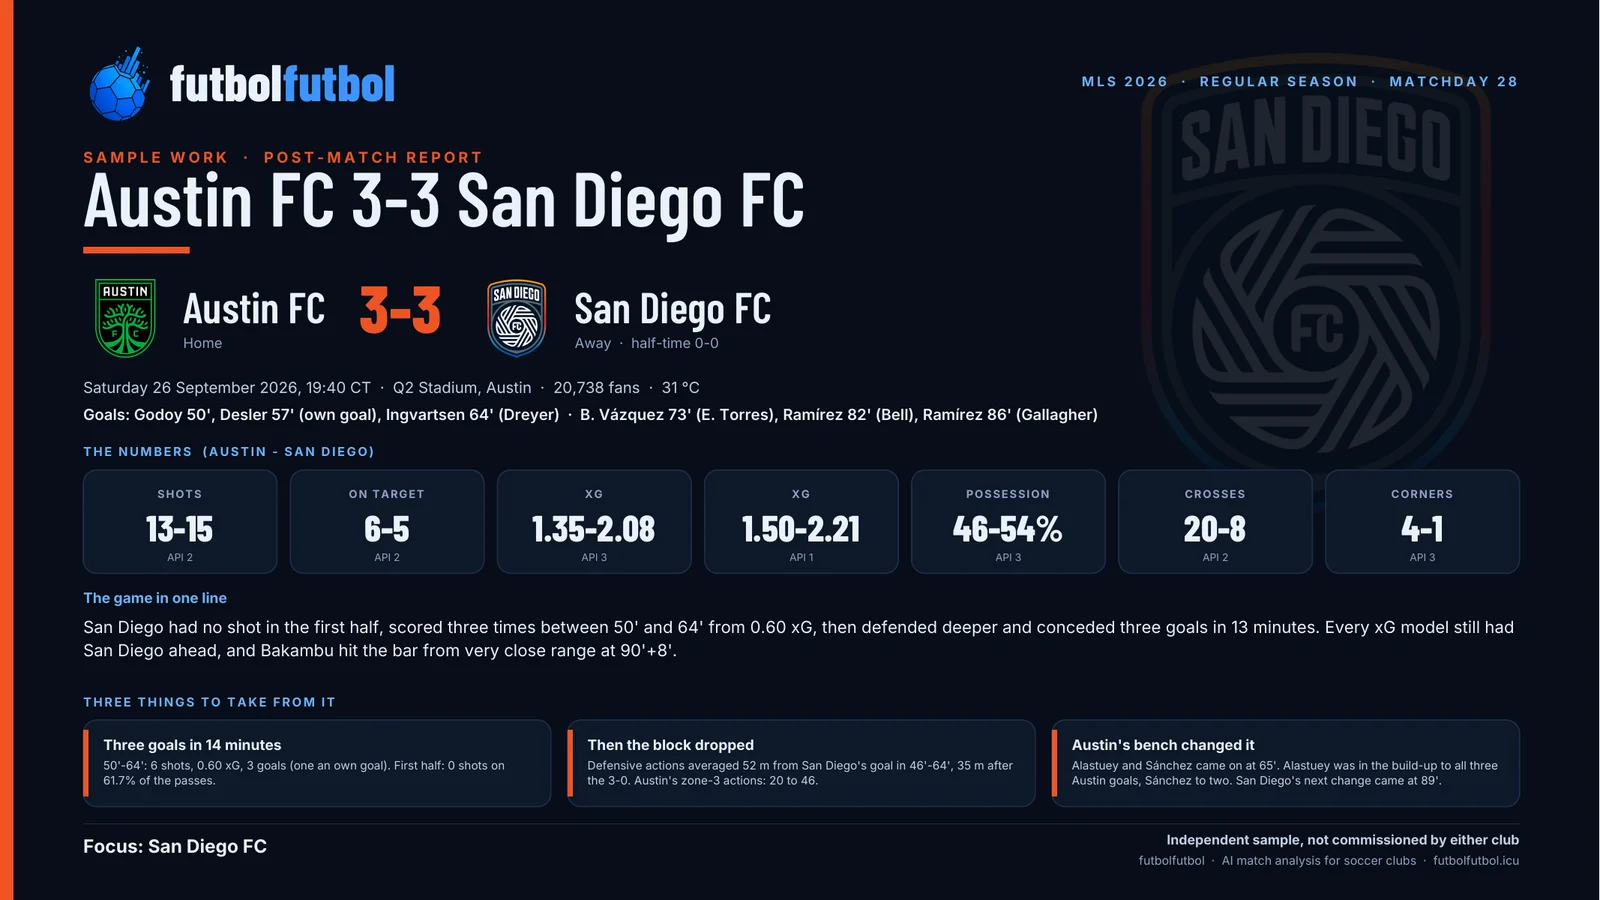
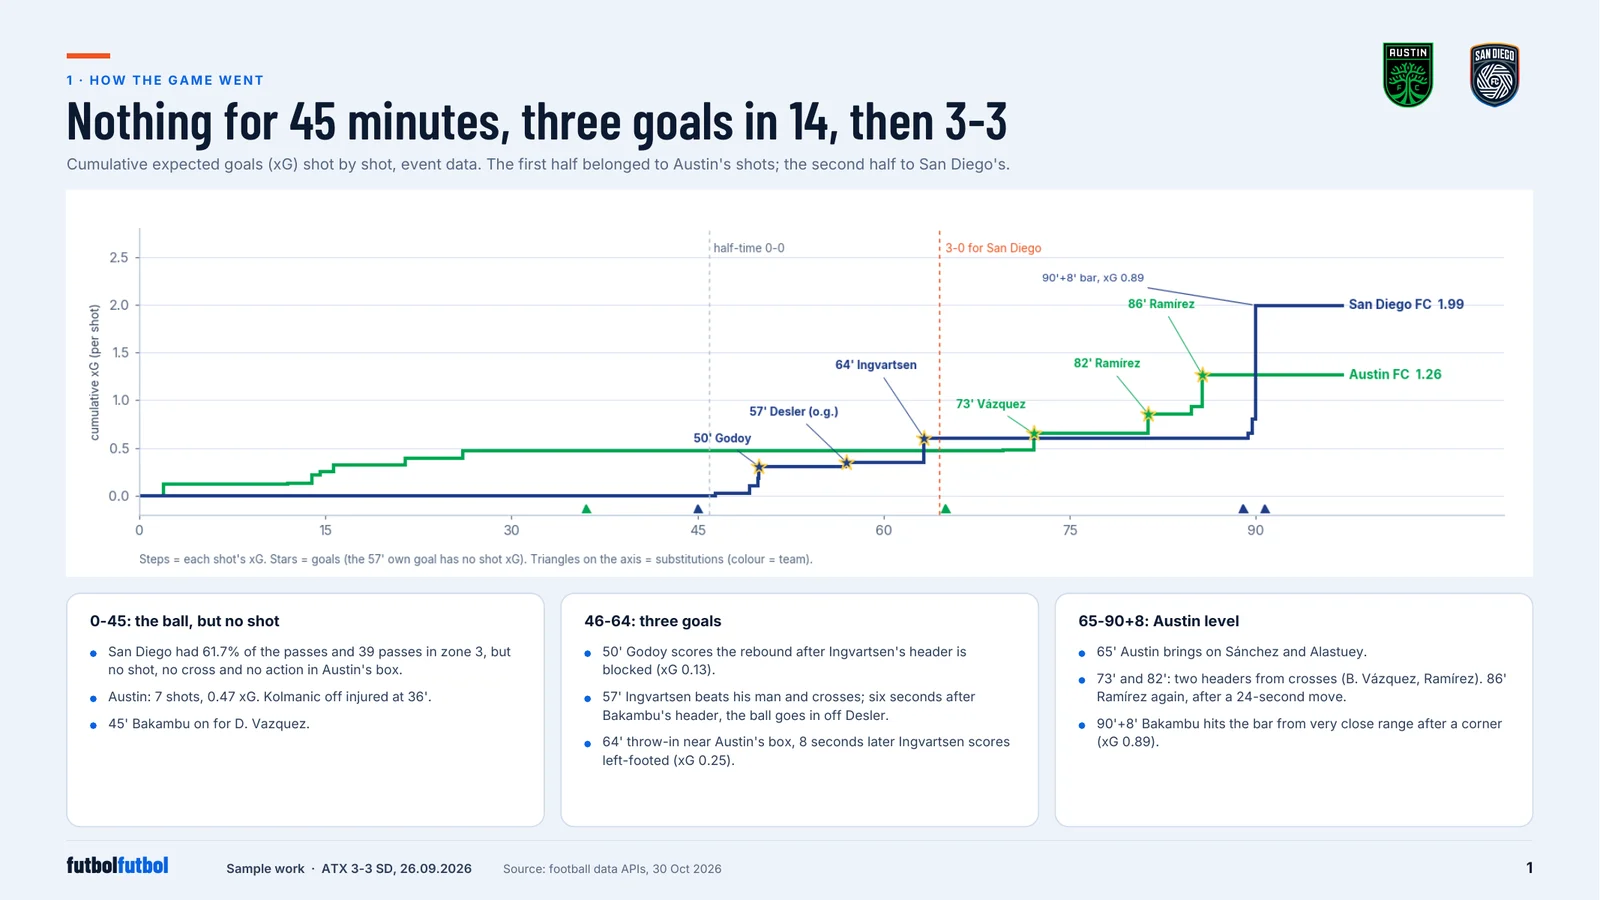
Sample work: pages from a 14-page post-match report on Austin FC 3-3 San Diego FC (MLS, 26 September 2026), built only from public match data, with the focus on San Diego FC. San Diego had 61.7% of the passes and no shot in the first half, then scored three times between 50' and 64' from 6 shots and 0.60 xG. After the 3-0 it won the ball back 17 m deeper, did not shoot again until the 90th minute, and Austin scored three goals in 13 minutes.
Choose a finding, compare the periods, then select an action to see where it happened. Every point comes from the report’s recorded events.
Numbers recounted against the reportCoaching questions await football analyst review.
What happened
Three goals between 50′ and 64′
San Diego went from 0–0 to 3–0 with goals at 50′, 57′ and 64′; the second was an own goal.
50′ · 57′ · 64′Goal minutes
6 / 0.60Shots / xG through 64.5′
1Own goal included
Why we think that
From the restart to the report’s 64.5-minute cut-off San Diego recorded 6 shots and 0.60 xG. In the first half it had 362 passes and no shot. Select a goal to follow the recorded attacking actions.
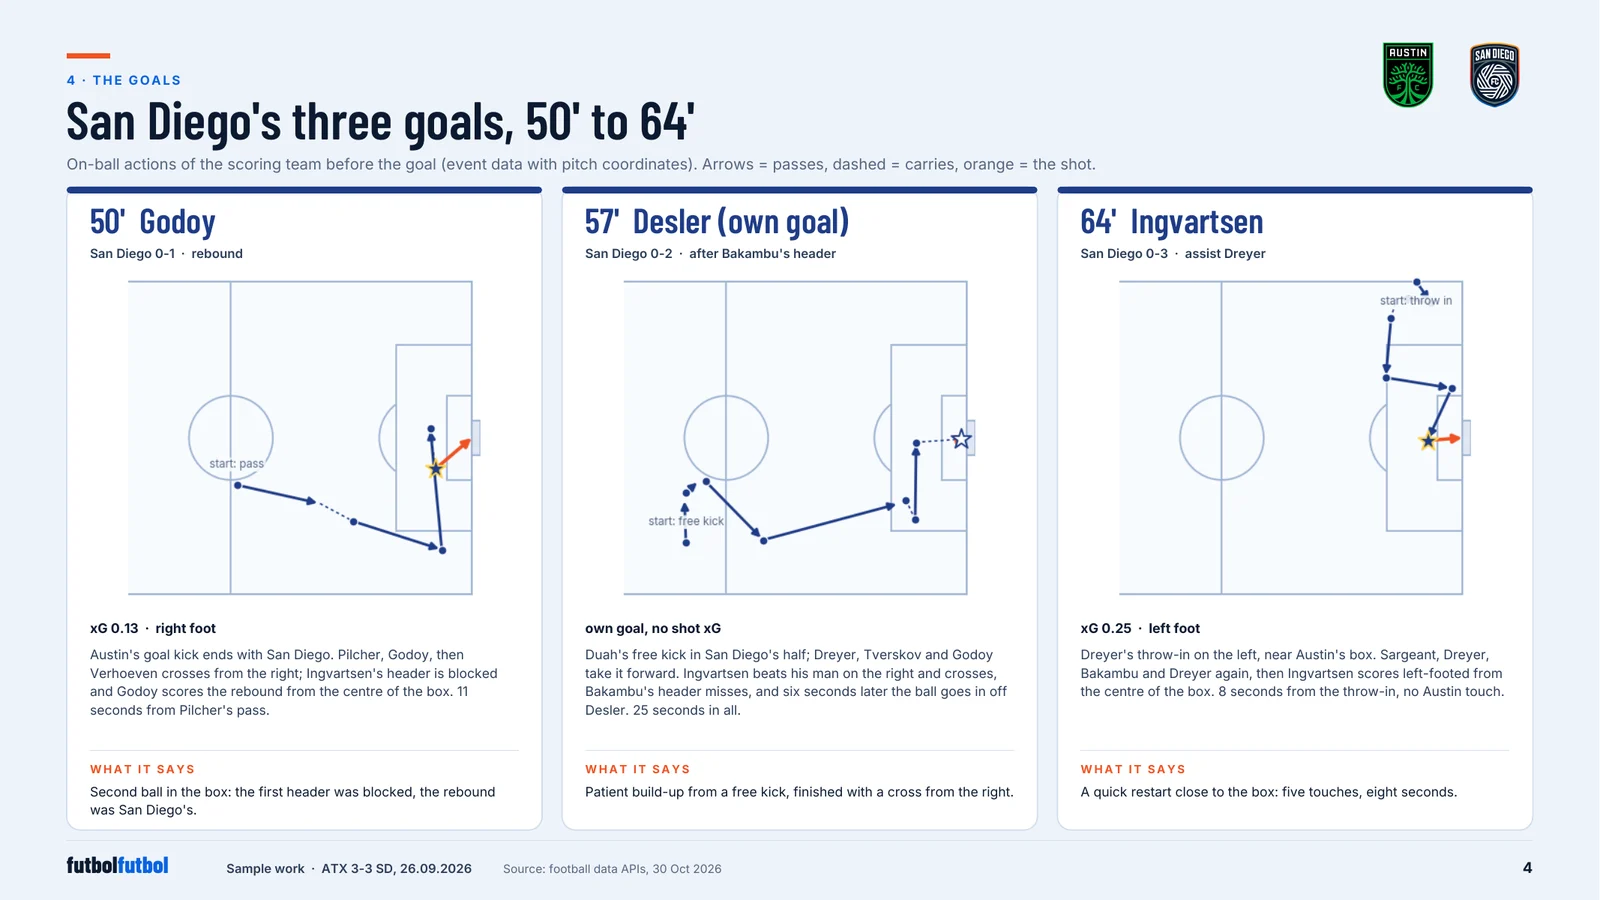
50' · Aníbal Godoy · 8 actions · xG 0.130
San Diego FC →← Austin FC
Fixed view: the focus team attacks right. Coordinates are on-ball locations on a standardized 105 × 68 m pitch, not player tracking.
Recorded actions
Select a recorded action. Arrows show recorded starts and ends, not an inferred ball path. Event counts are not possession counts.
What the staff could consider
What changed after half-time to turn circulation into box entries, and which of those movements can we repeat?
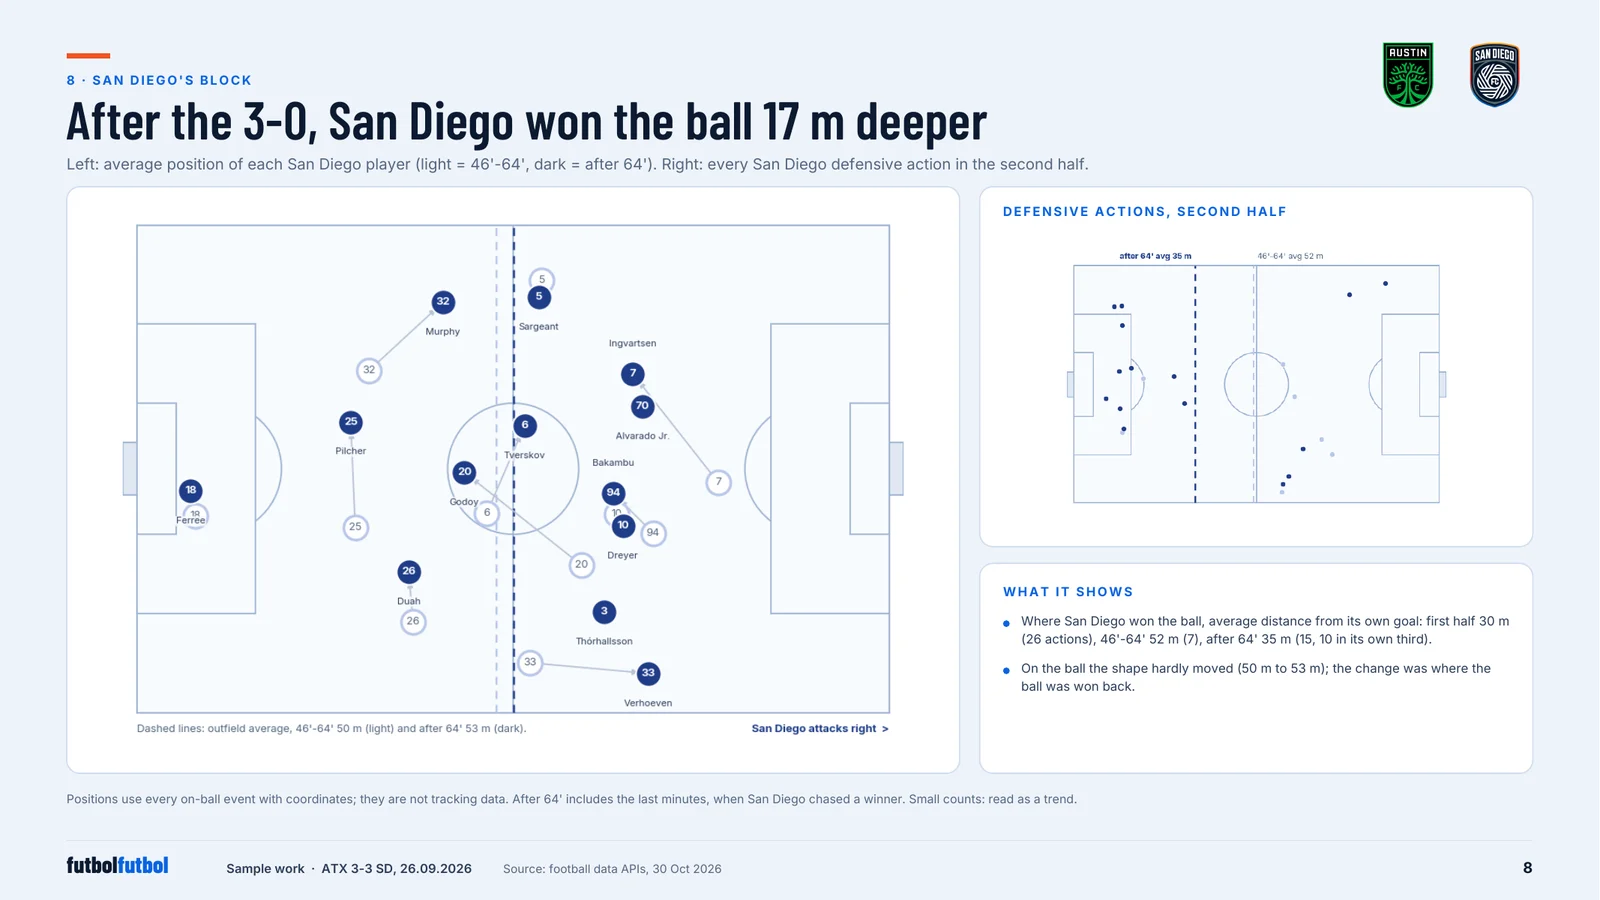
San Diego’s defensive actions averaged about 52 m from its own goal early in the second half, and 35 m after the report’s 64.5-minute cut-off.
52 → 35 mMean distance from own goal
7 / 15Defensive actions before / after
20 → 46Austin final-third actions
Why we think that
The samples contain 7 and 15 defensive actions. Austin’s final-third actions rose from 20 to 46 across those windows. Compare the actual points and the sample sizes.
After 64′ · 15 actions · Mean defensive-action distance from own goal: 34.8 m · In own third: 10/15
San Diego FC →← Austin FC
Fixed view: the focus team attacks right. Coordinates are on-ball locations on a standardized 105 × 68 m pitch, not player tracking.
Recorded actions
Select a recorded action. Arrows show recorded starts and ends, not an inferred ball path. Event counts are not possession counts.
What the staff could consider
With a three-goal lead, which cue tells us to restore pressure or change the outlet before the opponent gains territory?
Full-match totals. Model disagreement is not a statistical confidence interval.
Team
API 1
API 2
API 3
San Diego FC
2.21
1.99
2.08
Austin FC
1.50
1.26
1.35
Event diagrams only. Match video will be added when permission is available.
Inside the report
Six of the fourteen pages.
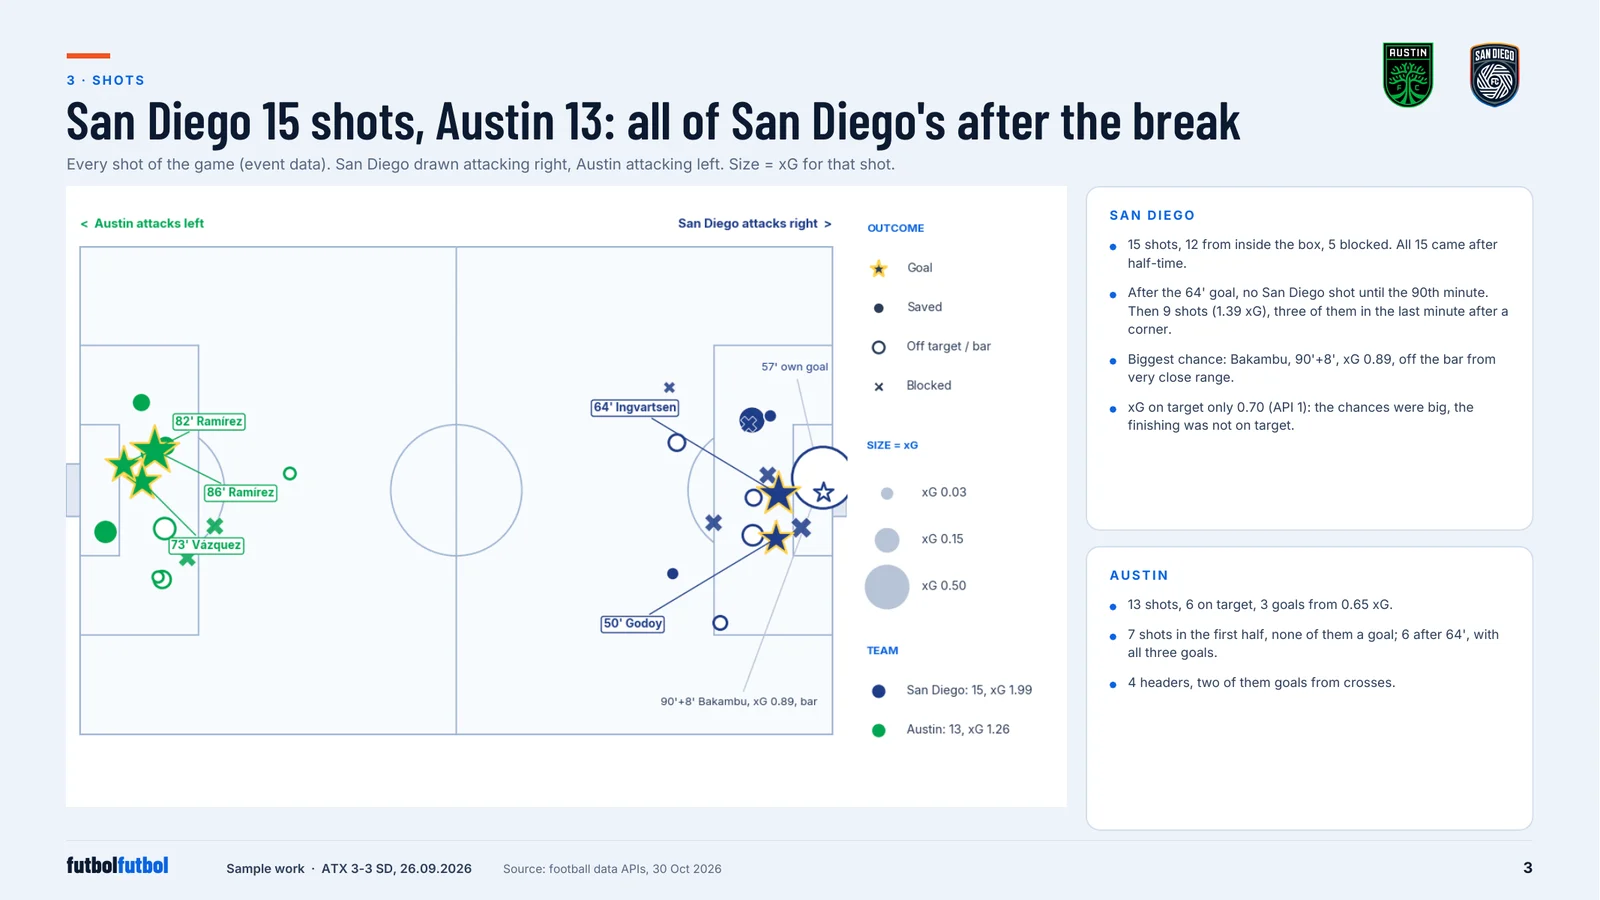
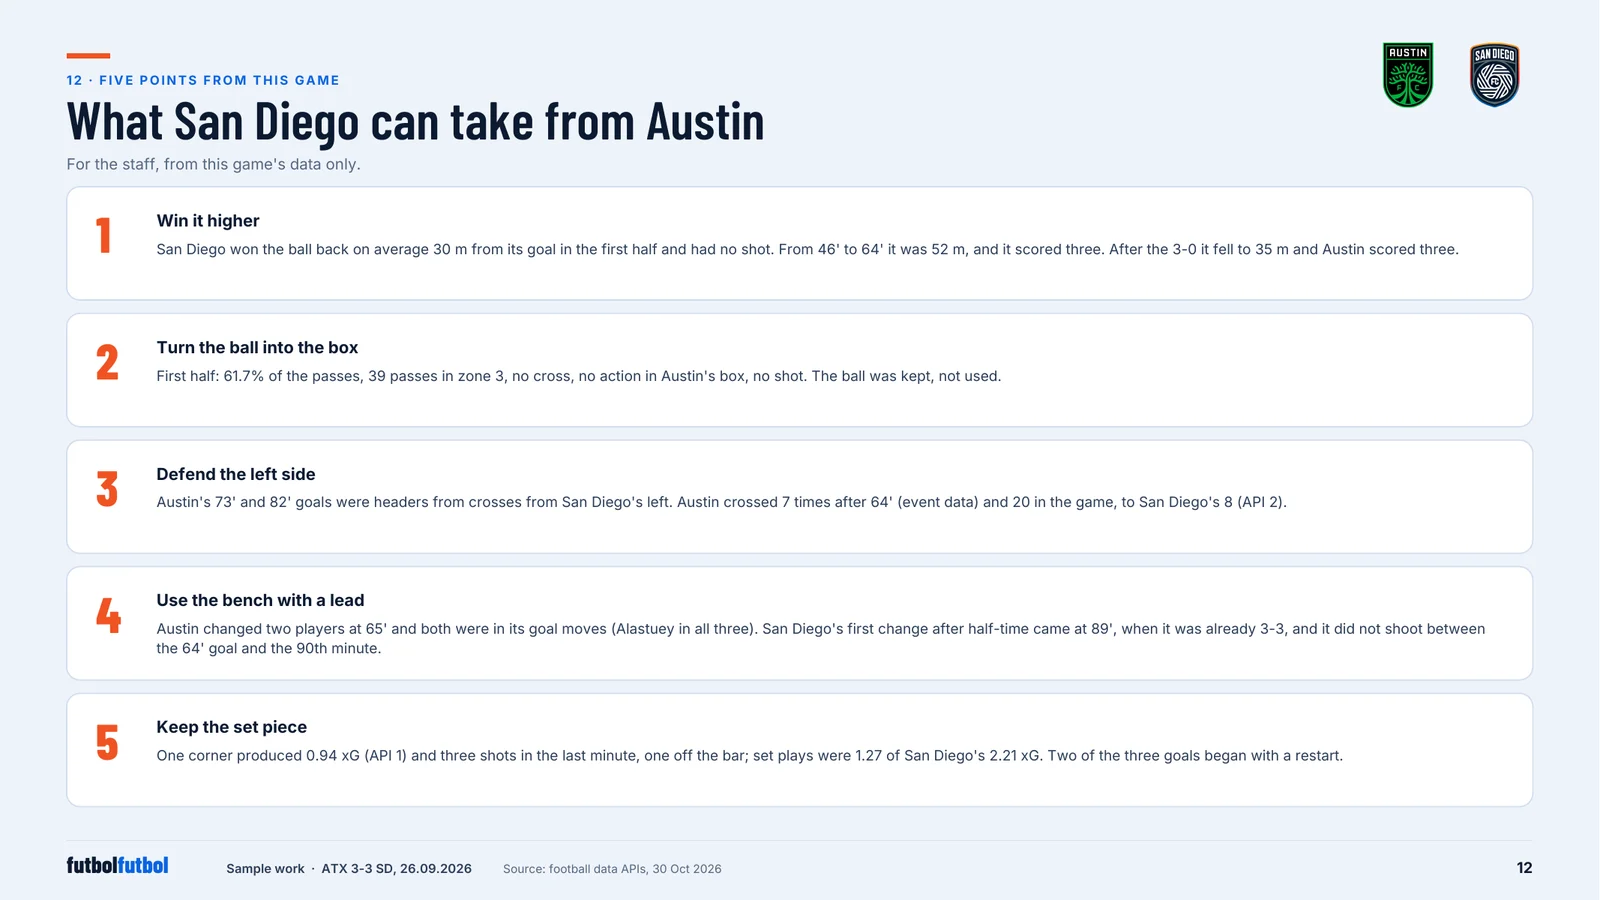
Cover. The match, the numbers from three football data APIs side by side, and the three things to take from it.How the game went. Expected goals shot by shot: nothing from San Diego for 45 minutes, three goals in 14, then 3-3, with a 0.89 xG chance off the bar at 90'+8'.Every shot. San Diego 15 shots, Austin 13. All of San Diego's came after half-time, and none between the 64' goal and the 90th minute.How each goal was made. San Diego's three goals drawn from the event data: a rebound, a 25-second move ending in an own goal, and a throw-in turned into a goal in 8 seconds.San Diego's block. Where San Diego won the ball: 30 m from its goal in the first half, 52 m from 46' to 64', 35 m after the 3-0.Five points from this game. Win it higher, turn the ball into the box, defend the left side, use the bench with a lead, keep the set piece.
Honest about the limits
What this sample cannot show.
It uses public match data only. Positions come from on-ball events, not tracking, so players off the ball are not seen. Different data models give different numbers; the report shows them side by side.
With a club's own statistics, GPS and match video, the same report adds tracking, physical load and drawn clips.
Data usedPublic match events, team and player statistics.
DeliveredThe day after the game, as a 14-page report.
With a clubPlus the club's statistics, GPS (XML or CSV) and video, and live notes on match day.
See it on one of your own games.
We send a sample report built on one of your recent games.